Figure 6.
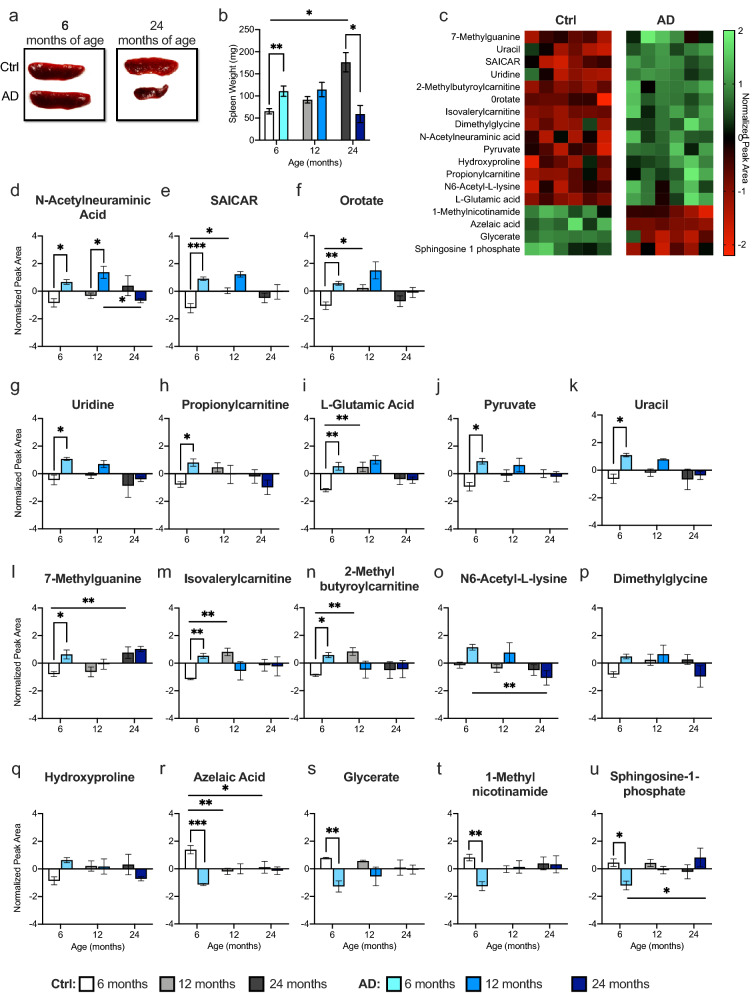
Splenomegaly contributes to early metabolite changes in AD mice at 6 months of age. (a) Representative images of spleens from 6- and 24-month-old Ctrl and AD mice. (b) AD mice exhibited significantly enlarged spleens at 6 months of age when compared to Ctrl mice. However, at 24 months of age, AD mice had significantly smaller spleens when compared with Ctrl mice. (c) Heat map of the 18 changed metabolites between Ctrl and AD mice at 6 months of age. Green indicates greater concentration and red indicates weaker concentration. (d–n) AD mice exhibited an increase in 11 out of the 18 metabolites altered in the spleen at 6 months of age. Ctrl and AD mice had similar metabolite levels at 12 and 24 months of age. (o–q) In 3 out of 18 metabolites, Ctrl and AD mice displayed similar levels of metabolites at each age. (r–u) AD mice showed decreased metabolite levels in 4 out of 18 metabolites (n = 3–6 male mice per group). Error bars represent ± SEM. *p < 0.05; **p < 0.01; ***p < 0.001. Ctrl control, AD Alzheimer’s disease, mg milligram, SAICAR phosphoribosylaminoimidazolesuccinocarboxamide.

