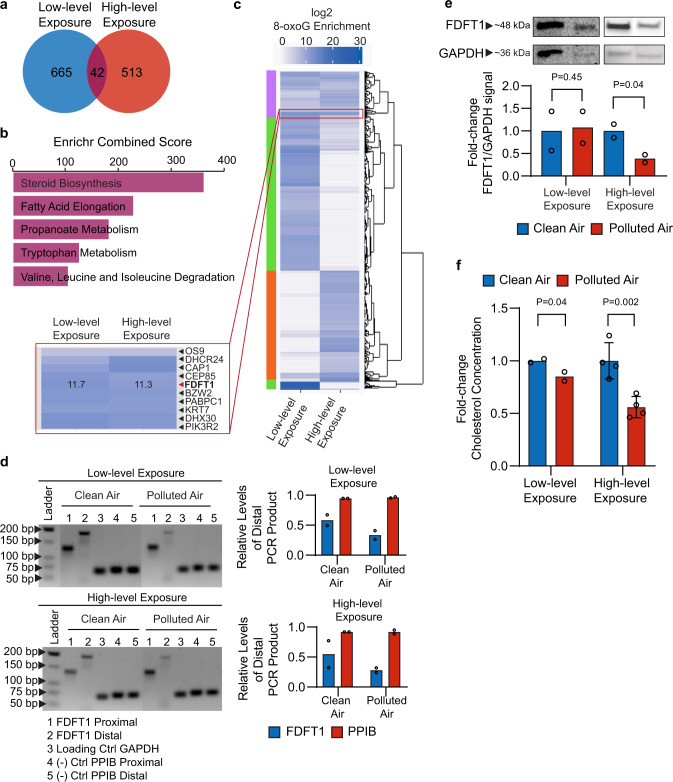
Fig. 3. Exposure of BEAS-2B cells to air pollution leads to alterations in cholesterol synthesis.
a Overlap between the air pollution-induced 8-oxoG transcripts derived from exposure at low-level and the high-level mixtures (Supplementary Data 7). b KEGG pathways analysis for the 42 8-oxoG transcripts overlapping between the low-level and high-level air pollution mixtures. c Heatmap showing 8-oxoG enrichment of low-level (Supplementary Data 3) and high-level exposures (Supplementary Data 6). Color scale represents 8-oxoG enrichment as log2-fold-change values. Transcripts with similar enrichment were clustered together using ggdendrogram R script. d PCR products of FDFT1–215 cDNA synthesized from low-level and high-level exposures. PCR products were separated in 3% agarose gel and stained with ethidium bromide. GAPDH was used as internal normalization, and PPIB was used as a negative control. The amount of PCR product was detected by densitometry using TotalLab CLIQS, and normalized by the level of the internal GAPDH product. The ratio of normalized distal/proximal products are plotted for FDFT1–215 and PPIB (n = 2 independent experiments). e Western blot of FDFT1 in BEAS-2B cells after exposures to the two air pollution levels (n = 2 independent experiments). Detection of GAPDH was used as internal loading control, which showed unchanged expression levels in the transcriptomics analysis. The signal intensity from the bands was quantified by densitometry using TotalLab CLIQS. f Endogenous cholesterol measured by a colorimetric assay from whole cellular lysates collected after low-level (n = 2 independent experiments) and high-level exposures (n = 4 independent experiments). Statistical difference was computed using t test analysis (one-tailed homoscedastic). Error bars are expressed as one standard deviation (s.d.).

