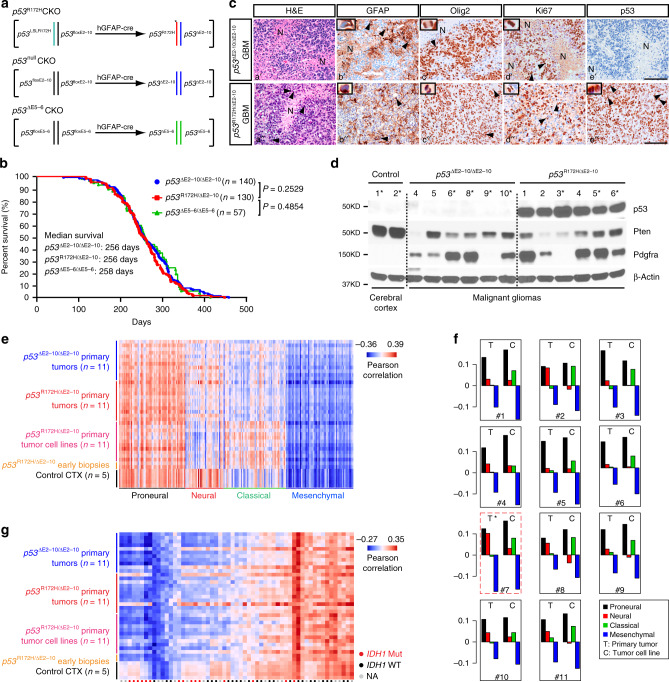
Fig. 1. p53CKO GEM models for human primary TP53-mutant IDH-WT GBM.
a Genetic configurations of hGFAP-cre-mediated recombination in the generation of three p53CKO models. b Kaplan–Meier survival curves for three p53CKO models. The Mantel–Cox (log-rank) test was used to statistically compare the overall survival. c Adjacent sections from representative brains with end-stage GBMs from p53nullCKO and p53R172HCKO mice were stained for H&E, GFAP, Olig2, Ki67, and p53. Pseudopalisading cells were observed adjacent to necrotic areas (a′–e′, a″). The arrows and inset show the tumor cell with perinuclear GFAP staining (b′, b″). Arrows and insets show abnormal mitotic figures at anaphase and/or metaphase in tumors (c′, d′, c″–e″). N necrosis. Scale bars: 50 µm. d Western blotting analyzed p53, Pten, and Pdgfrα levels in parenchymal gliomas/GBMs from p53nullCKO (n = 6) and p53R172HCKO (n = 6) mice. Normal adult cortical tissues from hGFAP-cre+; p53floxE2–10/+ (n = 2) mice were used as controls (Ctr). “*” marks the samples with both western blotting (d) and microarray (Supplementary Fig. 1n, red points) analysis. Source data are provided as a Source data file. e Gene expression profiles of primary tumor tissues of p53nullCKO mice (n = 11), paired primary tumor tissues and primary tumor-derived cell lines of p53R172HCKO mice (n = 11), primary tumor-derived cell lines from early stage p53R172HCKO biopsies (n = 2), and normal cortical tissues (CTX, n = 5) were compared to human GBMs (n = 202) using the classification system established by Verhaak et al.23. Red indicates strong sample-wise Pearson correlation; blue indicates the reverse. See methods for details. f Gene expression profiles of paired p53R172HCKO primary tumor and primary tumor-derived cell lines were scored based on their gene expression similarity to four human GBM subtypes. Positive values indicate similarity. Primary tumor #7 (red box, *) was documented by histology with normal tissue contamination prior to microarray analysis. g Gene expression profiles of the same set of samples from (e) were compared to human proneural subtype GBMs with or without IDH1 mutations (red or black dots). See methods for details.

