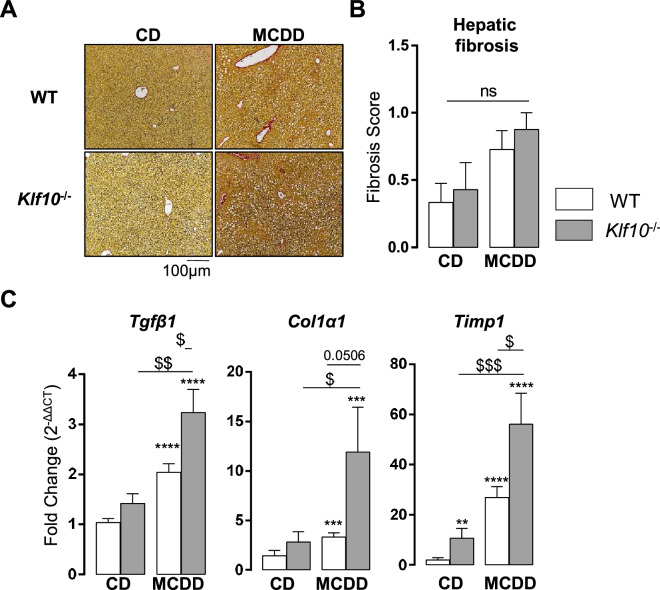
Figure 6.
Klf10 deficient mice display enhanced fibrosis priming upon MCDD challenge. (A) Representative images of liver sections sand tained with Picro Sirius red from WT and Klf10-/- animals fed a CD or MCDD for 4 weeks (ZT3). (B) Quantification of hepatic fibrosis using the clinical fibrosis score (Ishak) (n = 7–12 mice/group). (C) Hepatic gene expression of Tgfβ1, Col1α1and Timp1 in WT and Klf10-/- mice sacrificed at ZT3 (n = 8–12 mice/group). All the data are expressed as mean ± SEM. The mRNA levels are normalized to B2m and expressed as relative to the CD level ZT3 (n = 12). Statistical significance was tested using the Mann-Whiney test vs the control group (stars) or the indicated groups (dollar symbols), **** p < 0.0001; ** and $$ p < 0.01; $ p < 0.05.

