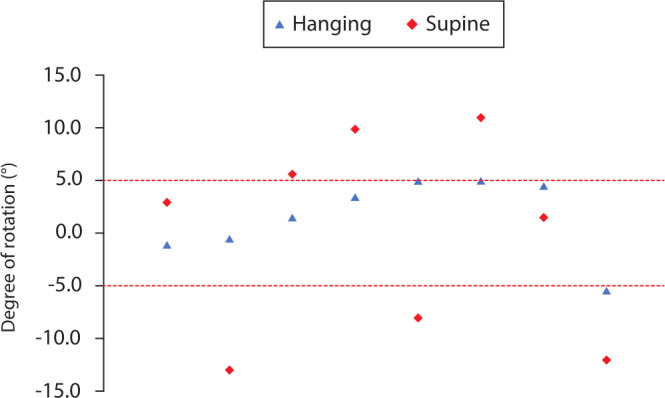
Fig. 3.

Tibial rotation comparison. The distribution of tibial component rotation is shown for the two groups of knees. Rotation is represented along the y-axis with negative values representing external rotation and positive values representing internal rotation. There were significantly more outliers for tibial rotation outside the acceptable range of ± 5° in the supine leg position (n = 6) compared to those in the hanging leg position (n = 1).
