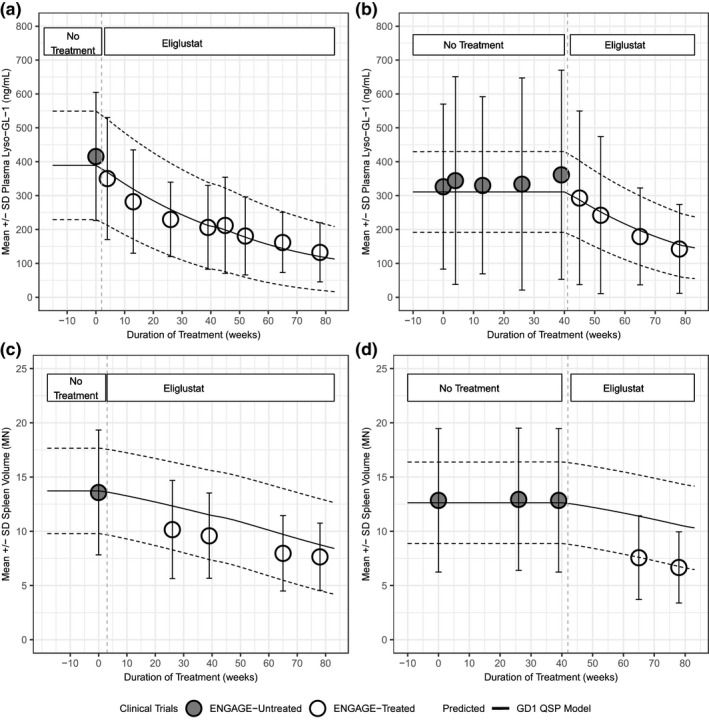
Figure 3.

Comparison of simulation results for a population of 1,000 virtual patients to clinical data. Simulated results for plasma glucosylsphingosine (lyso‐GL)‐1 (a) and spleen volume (c) response to eliglustat overlaid with clinical data from active arm from ENGAGE trial. Simulated results for plasma‐lyso‐GL1 (b) and spleen volume (d) response to eliglustat overlaid with clinical data from the placebo arm and open‐label period of the ENGAGE trial. Mean of virtual population (black solid line), and SD (dashed lines). Mean clinical data from patients are shown as points (white circles: treated arm in ENGAGE trial; gray circles: untreated arm in ENGAGE trial) with SD.
