
Figure 4.
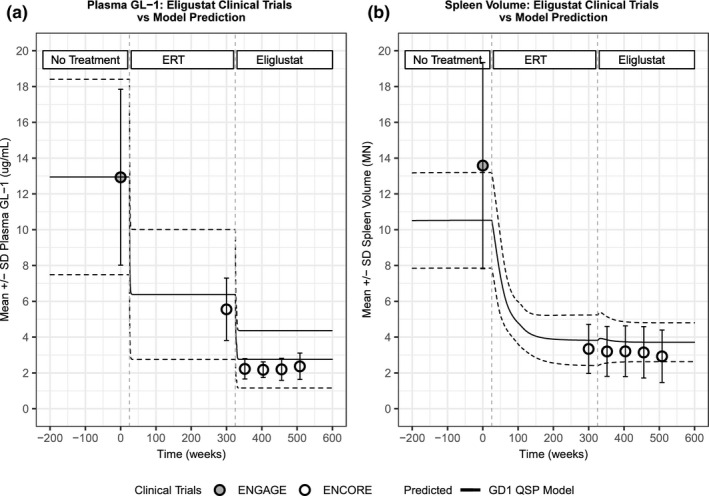
Model recapitulates switch scenario from enzyme replacement therapy (ERT) to eliglustat. Model‐predicted responses (mean: black, solid lines; SD: black, dashed lines) in plasma glucosylceramide (GL)‐1 (a) and spleen volume (b) for previously untreated patients stabilized with Cerezyme and then switched to eliglustat, compared with clinical measurements (mean and SD) from the ENGAGE trial at baseline (gray circles) and the ENCORE trial baseline and after 52 weeks of treatment (white circles). GD, Gaucher’s disease; QSP, quantitative systems pharmacology.