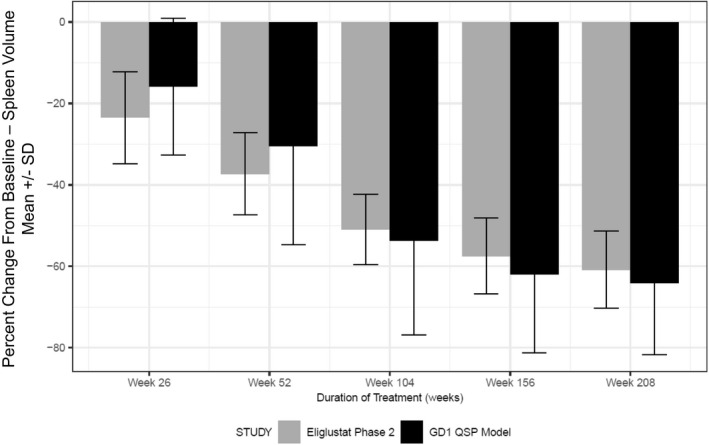
Figure 6.

Quantitative systems pharmacology (QSP) model‐predicted responses in spleen volume changes. Simulation results of virtual population constructed in Figure 5 was treated with eliglustat (mean and SD: dark, closed bars) compared with clinical measurements (mean and SD: gray, closed bars) from the phase II eliglustat clinical trial. GD1, Gaucher’s disease type 1.
