
Figure 2.
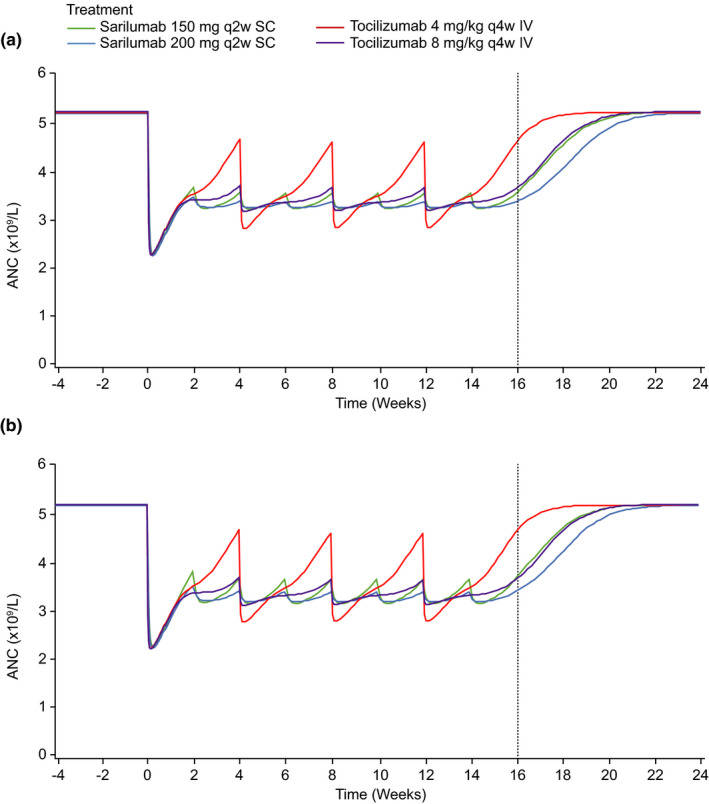
Median simulated ANC over time from covariate MT model. (a) Model training dataset and (b) sensitivity analysis dataset. The vertical dotted line indicates the last trough day. ANC, absolute neutrophil count; MT, margination–tolerance.
Official websites use .gov
A
.gov website belongs to an official
government organization in the United States.
Secure .gov websites use HTTPS
A lock (
) or https:// means you've safely
connected to the .gov website. Share sensitive
information only on official, secure websites.
Median simulated ANC over time from covariate MT model. (a) Model training dataset and (b) sensitivity analysis dataset. The vertical dotted line indicates the last trough day. ANC, absolute neutrophil count; MT, margination–tolerance.