
Figure 3.
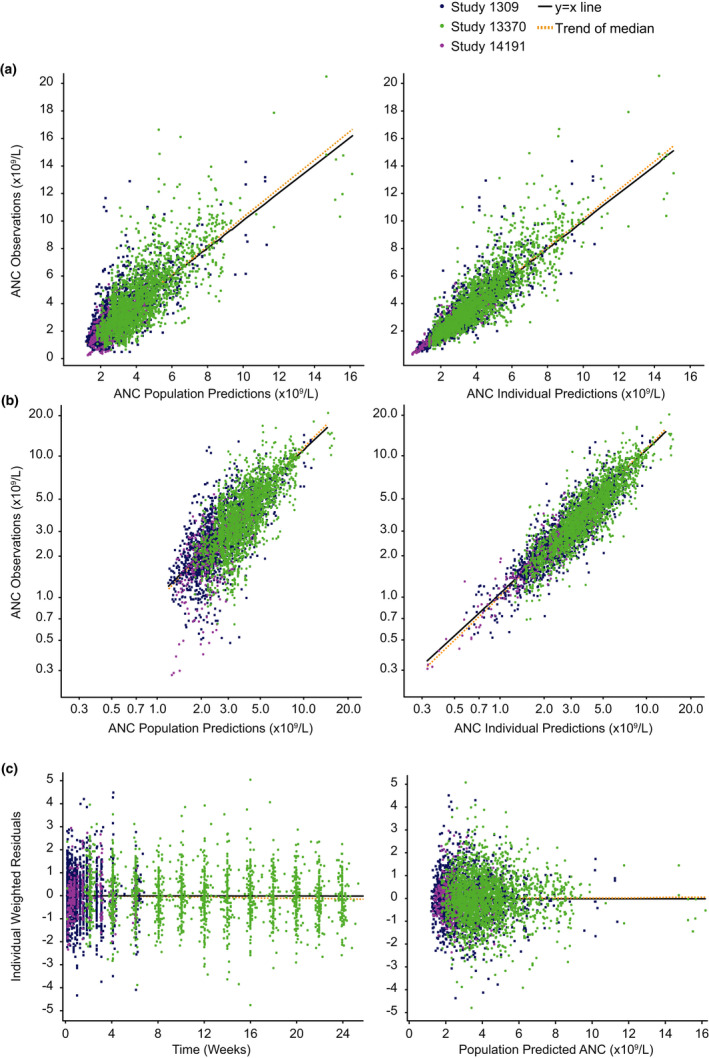
Diagnostic plots. (a) Population and individual observed vs. predicted ANC, (b) log‐scaled population and individual observed vs. predicted ANC, and (c) IWRES vs. time and population‐predicted ANC. ANC, absolute neutrophil count; IWRES, individual weighted residuals.