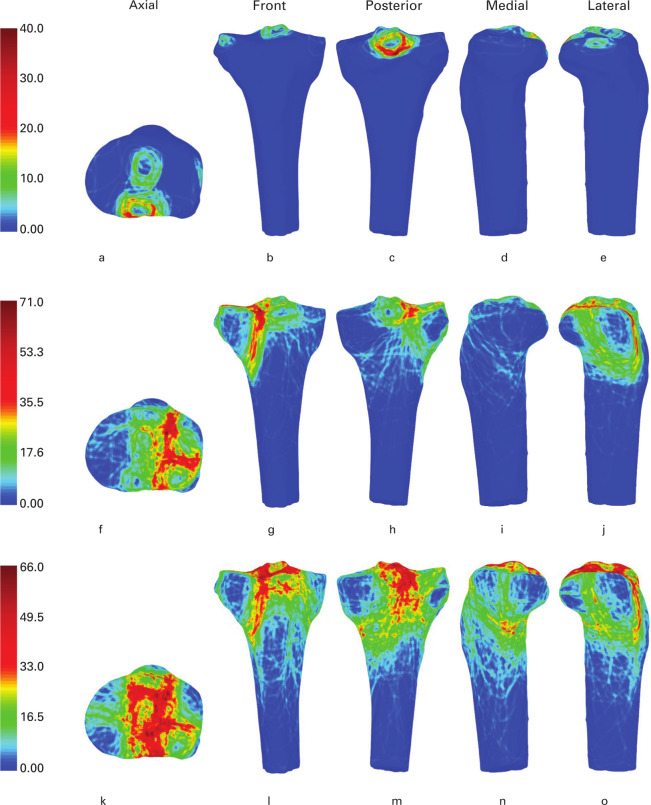
Fig. 5.
Representative views of the 3D heat mapping of fracture lines according to the Orthopaedic Trauma Association/AO Foundation (OTA/AO): a) to e) type A; f) to j) type B; and k) to o) type C. These include the axial, front, posterior, medial, and lateral views. Red colour represents higher frequency of fracture line density.

