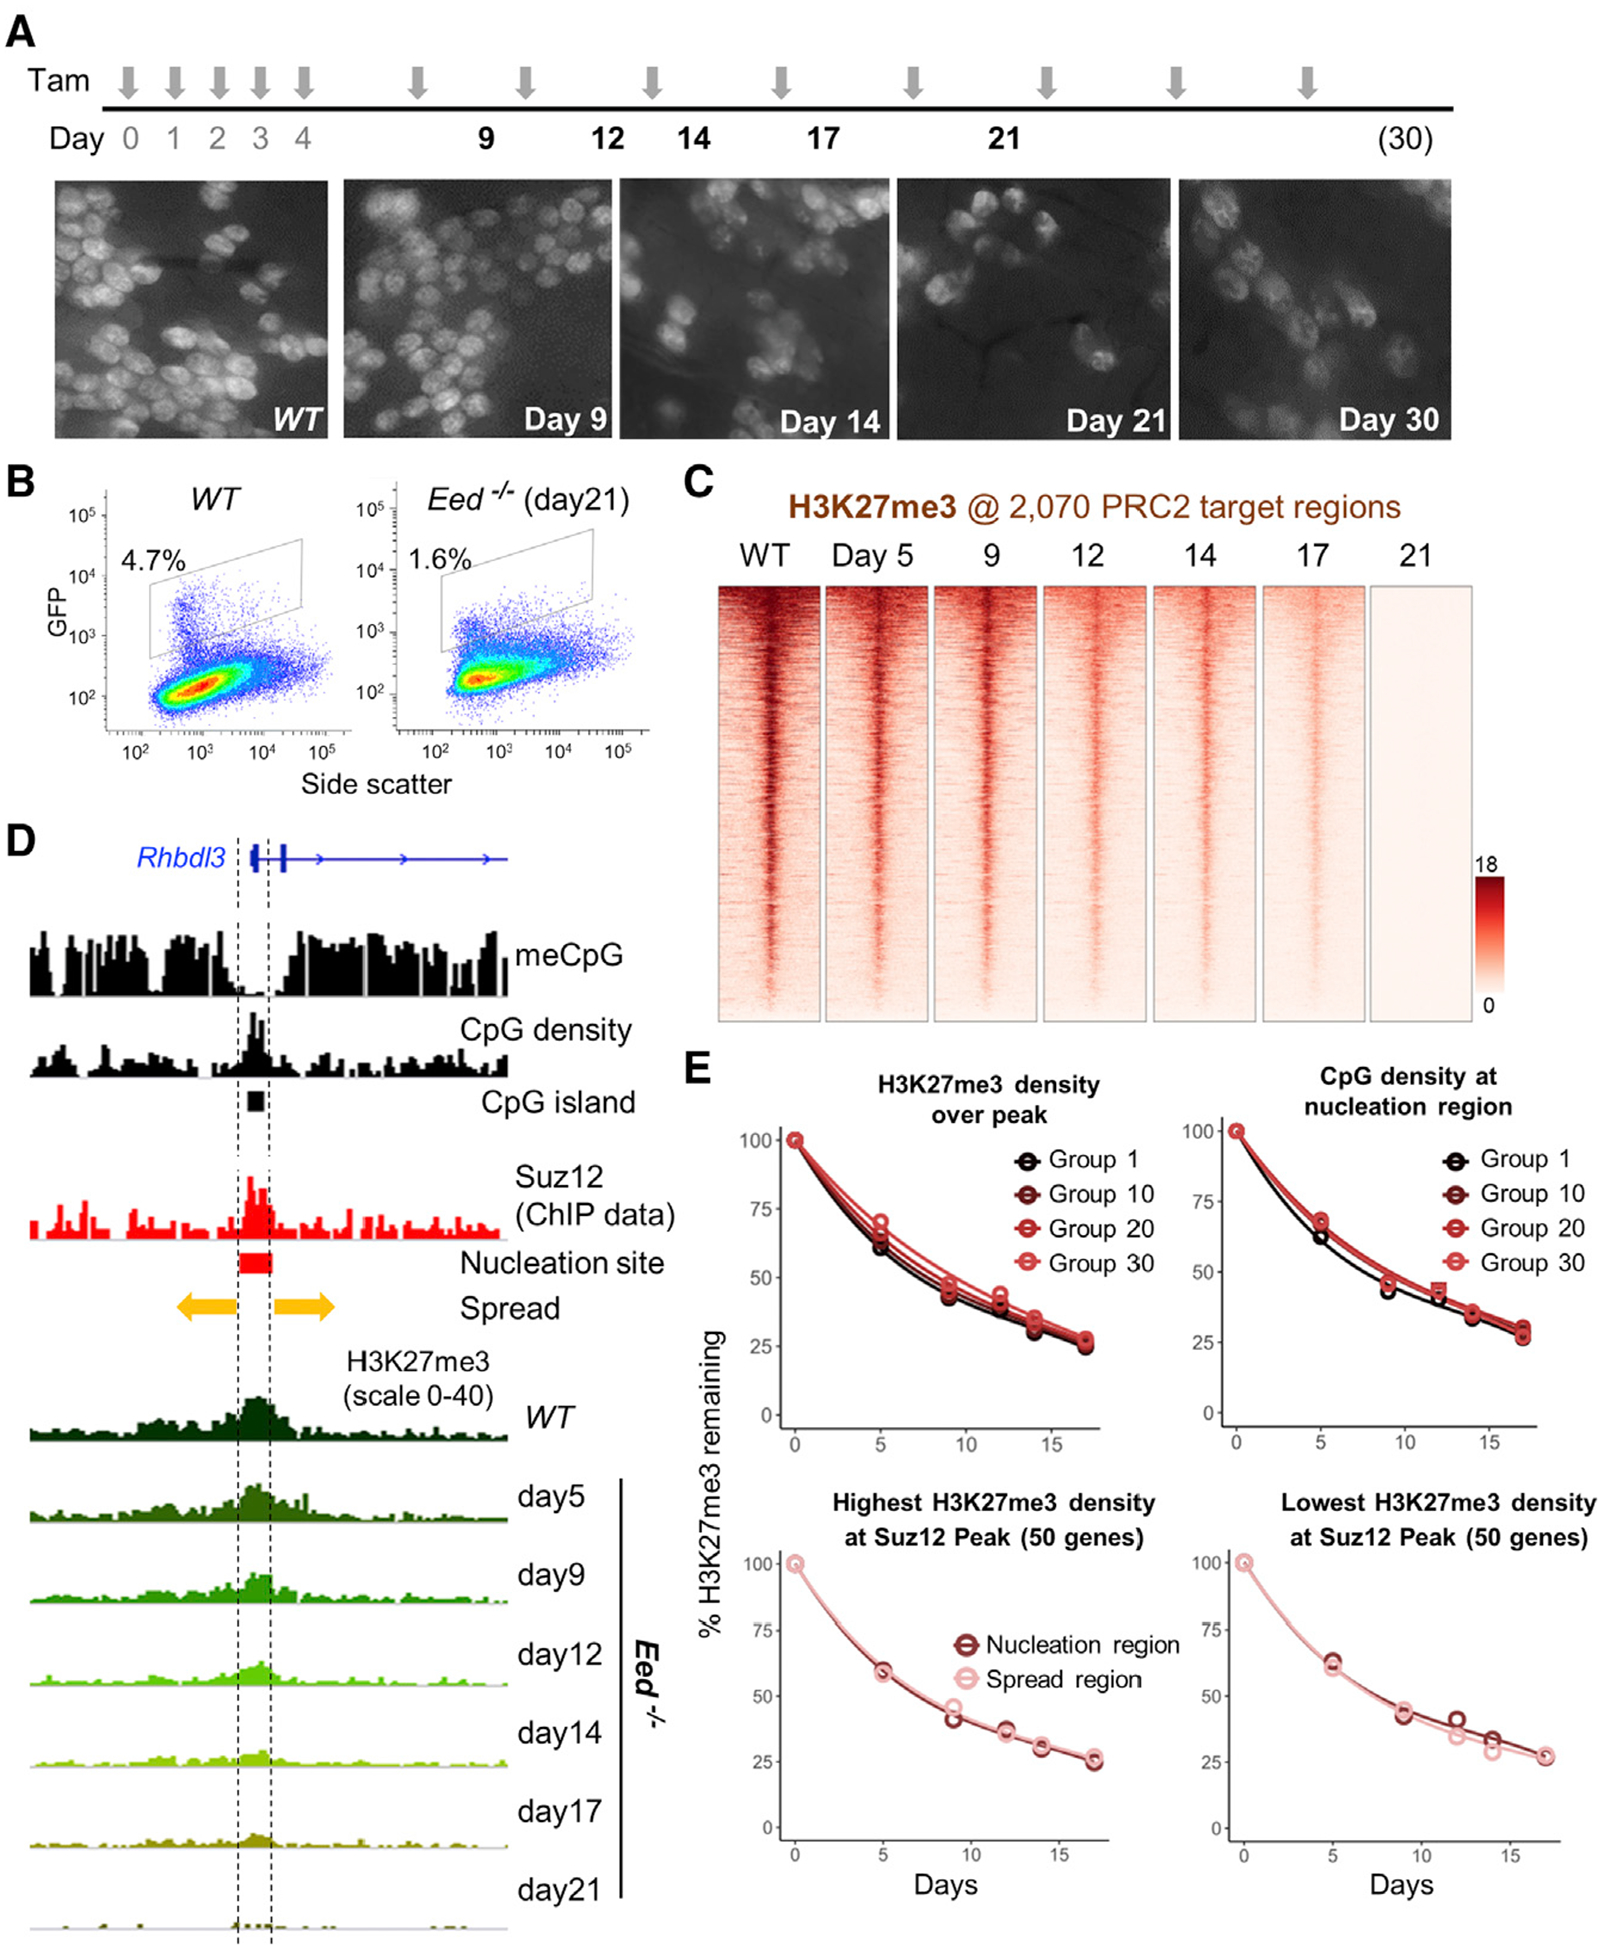
Figure 3. Replicational Dilution of H3K27me3 at Target Genes in PRC2-Deficient ISCs.

(A) Experimental scheme showing induction of PRC2 loss, induced by tamoxifen (TAM), and ISC collection times to quantify H3K27me3 and mRNA levels. Whole-mount fluorescence micrographs show progressive depletion of crypts containing GFP+ ISCs in EedFl/Fl;Lgr5GFP-Cre(ER) mouse duodenum. Images represent intestines from 2 mice at 30 days and 3 mice at all other times.
(B) Quantitation of Lgr5+ ISCs by GFP flow cytometry before and 21 days after PRC2 loss.
(C) Progressive loss of H3K27me3 at 2, 070 target promoters (TSS ± 10 kb) in the absence of PRC2 function. Genes in the heatmaps are ordered by decreasing H3K27me3 signals in WT ISCs.
(D) IGV tracks at a representative promoter, Rhbdl3, showing the variables known to influence H3K27me3 distribution, including methylated DNA, CpG density (CpG islands), and Suz12 binding (nucleation region). Kinetics of H3K27me3 decay in Eed−/− ISCs are not influenced by these variables, as indicted by the uniform proportional loss across the locus.
(E) In aggregate, the progressive loss of H3K27me3 in Eed−/− ISCs occurs with similar kinetics at sites with high or low starting H3K27me3, CpG dinucleotide density over the Suz12 peak, and in the nucleation or spread regions. Promoters were placed in 50-gene groups from highest to lowest. Graphs are shown for groups 1 (top 50), 10 (genes 501–550), 20 (genes 1, 001–1, 050) and onward. For analysis of nucleation versus spread regions (bottom), groups with the highest (left) and lowest (right) H3K27me3 density at the Suz12 peak are shown.
See also Figure S2.
