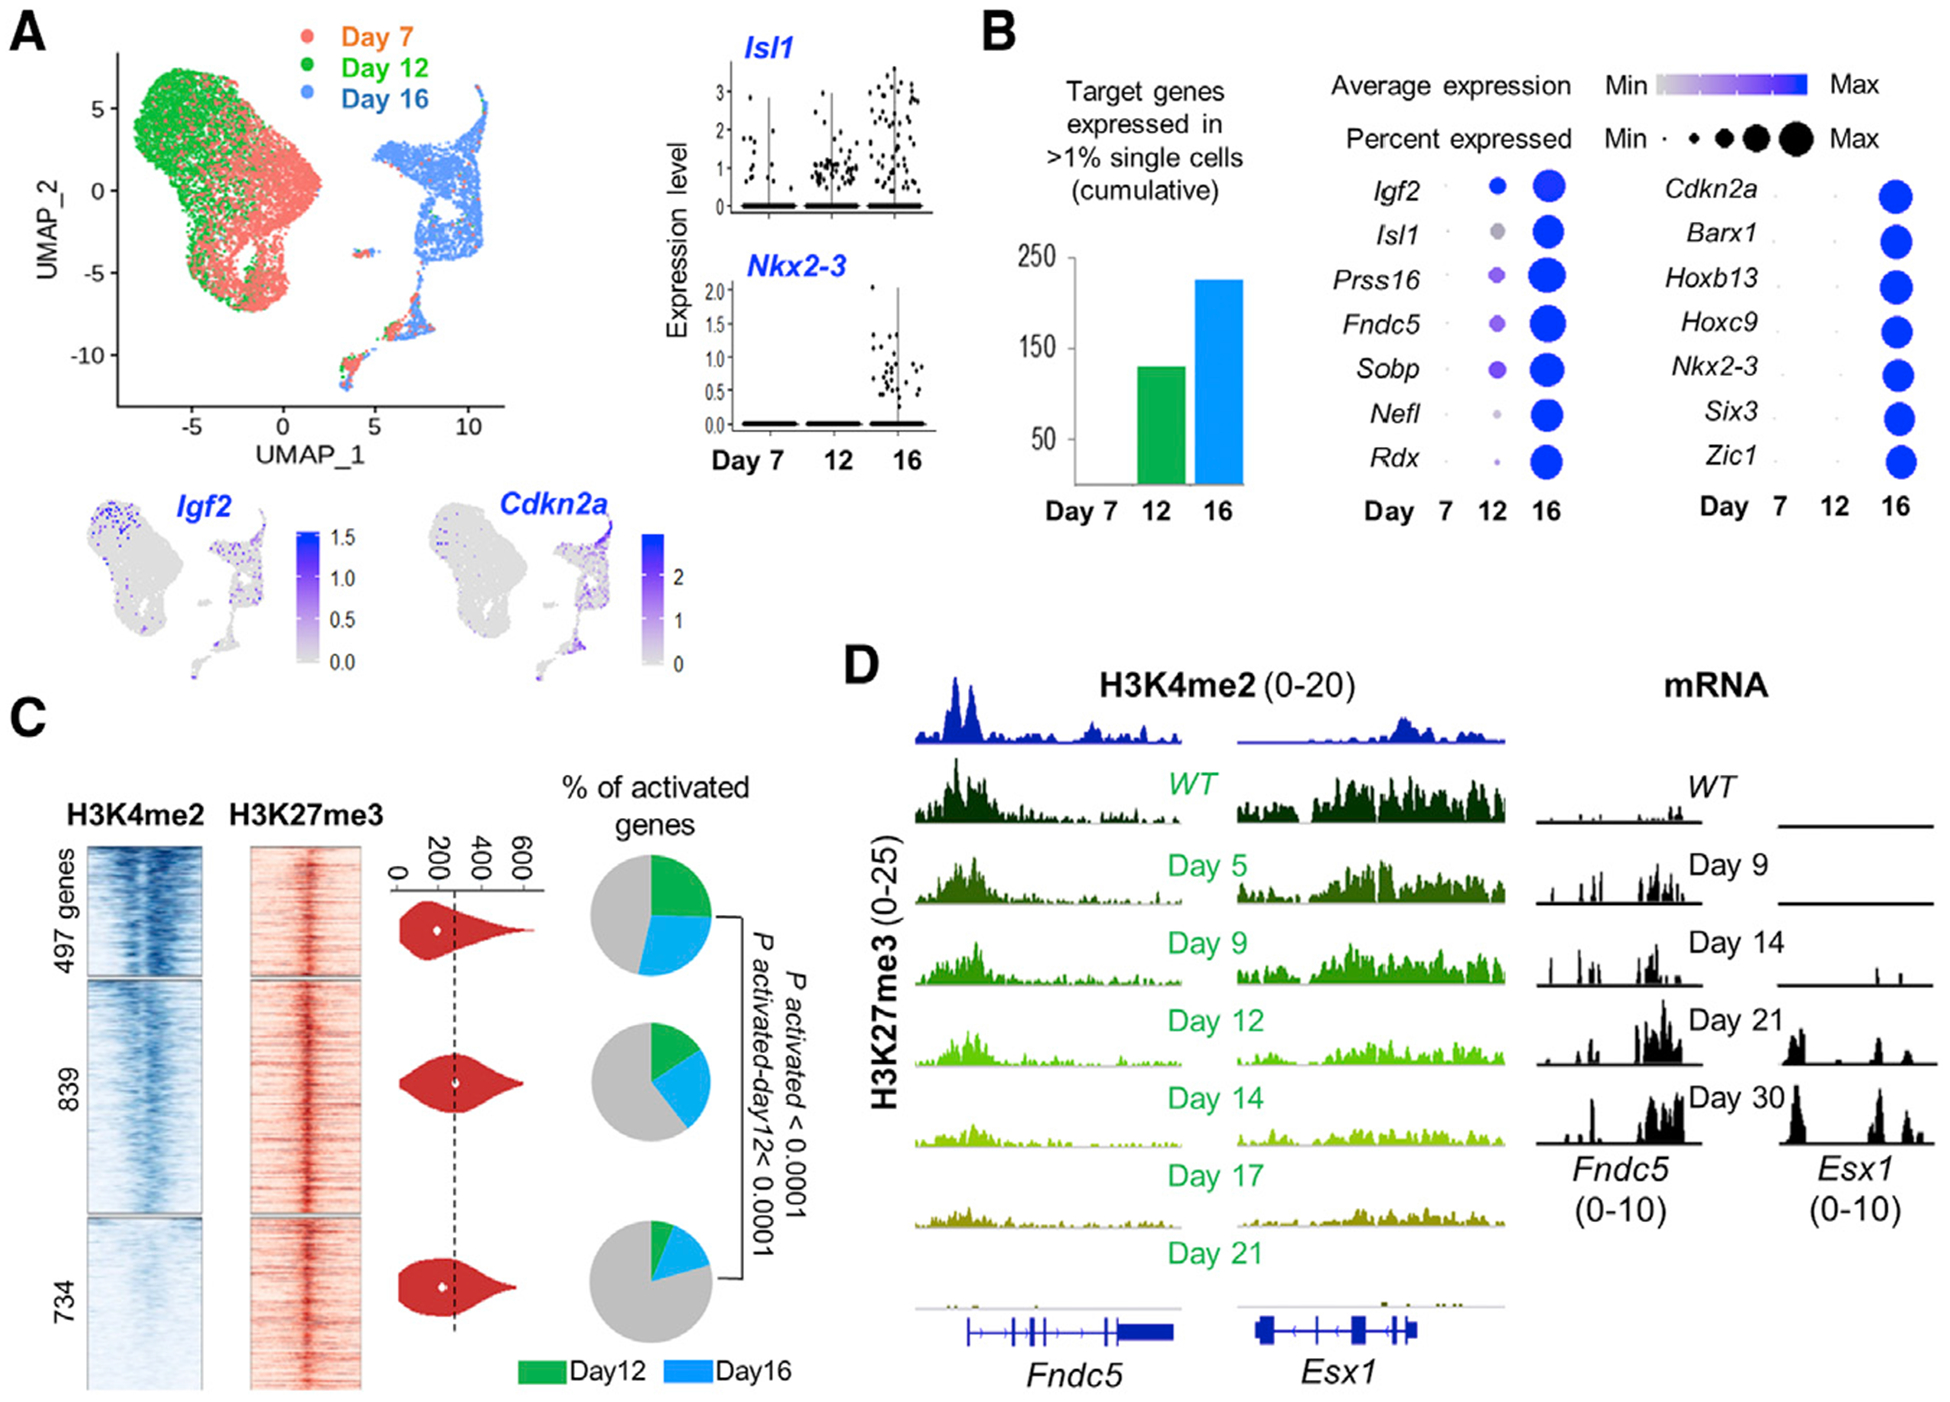
Figure 5. Progressive Derepression of PRC2 Targets Is Associated with Promoter Poising.

(A) Uniform manifold approximation and projection (UMAP) plots from RNA analysis of single Eed−/− ISCs harvested on different days after PRC2 inactivation. Representative target genes Igf2 and Cdkn2a (projected on the UMAP template) and Isl1 and Nkx2–3 (violin plots, right) show early (day 12) or delayed (day 16) activation.
(B) Left, increasing numbers of PRC2 target transcripts were detected in >1% of cells on days 12 and 16, compared with their absence on day 7. Right, progressive gains in RNA levels (color scale) and the fraction of cells with measurable RNA (dot diameter) of PRC2 target genes, starting with their silence as late as 7 days after Eed deletion. Some targets activate earlier than others.
(C) Promoter H3K4me2 (TSS ± 1.5 kb) and H3K27me3 (TSS ± 10 kb) signals in ISCs at 2, 070 PRC2 target genes, grouped in 3 k-mean clusters based on H3K4me2 signal density. H3K27me3 signals in the 3 clusters are similar (quantified in violin plots). Pie charts show that genes with high promoter H3K4me2 have higher (q < 0.0001, “N-1” chi-square test) activation, both overall and specifically on day 12 versus day 16.
(D) Representative IGV tracks at Fndc5 and Esx1, genes with different degrees of promoter poising (H3K4me2). Upon PRC2 loss, H3H27me3 is cleared proportionally, whereas Fndc5 (high promoter H3K4me2) activates sooner than Esx1 (low H3K4me2).
See also Figure S3.
