
Extended Data Fig. 4 |. Administration of IL-22 prevented insulin resistance and ovarian dysfunction in B. vulgatus-treated mice.
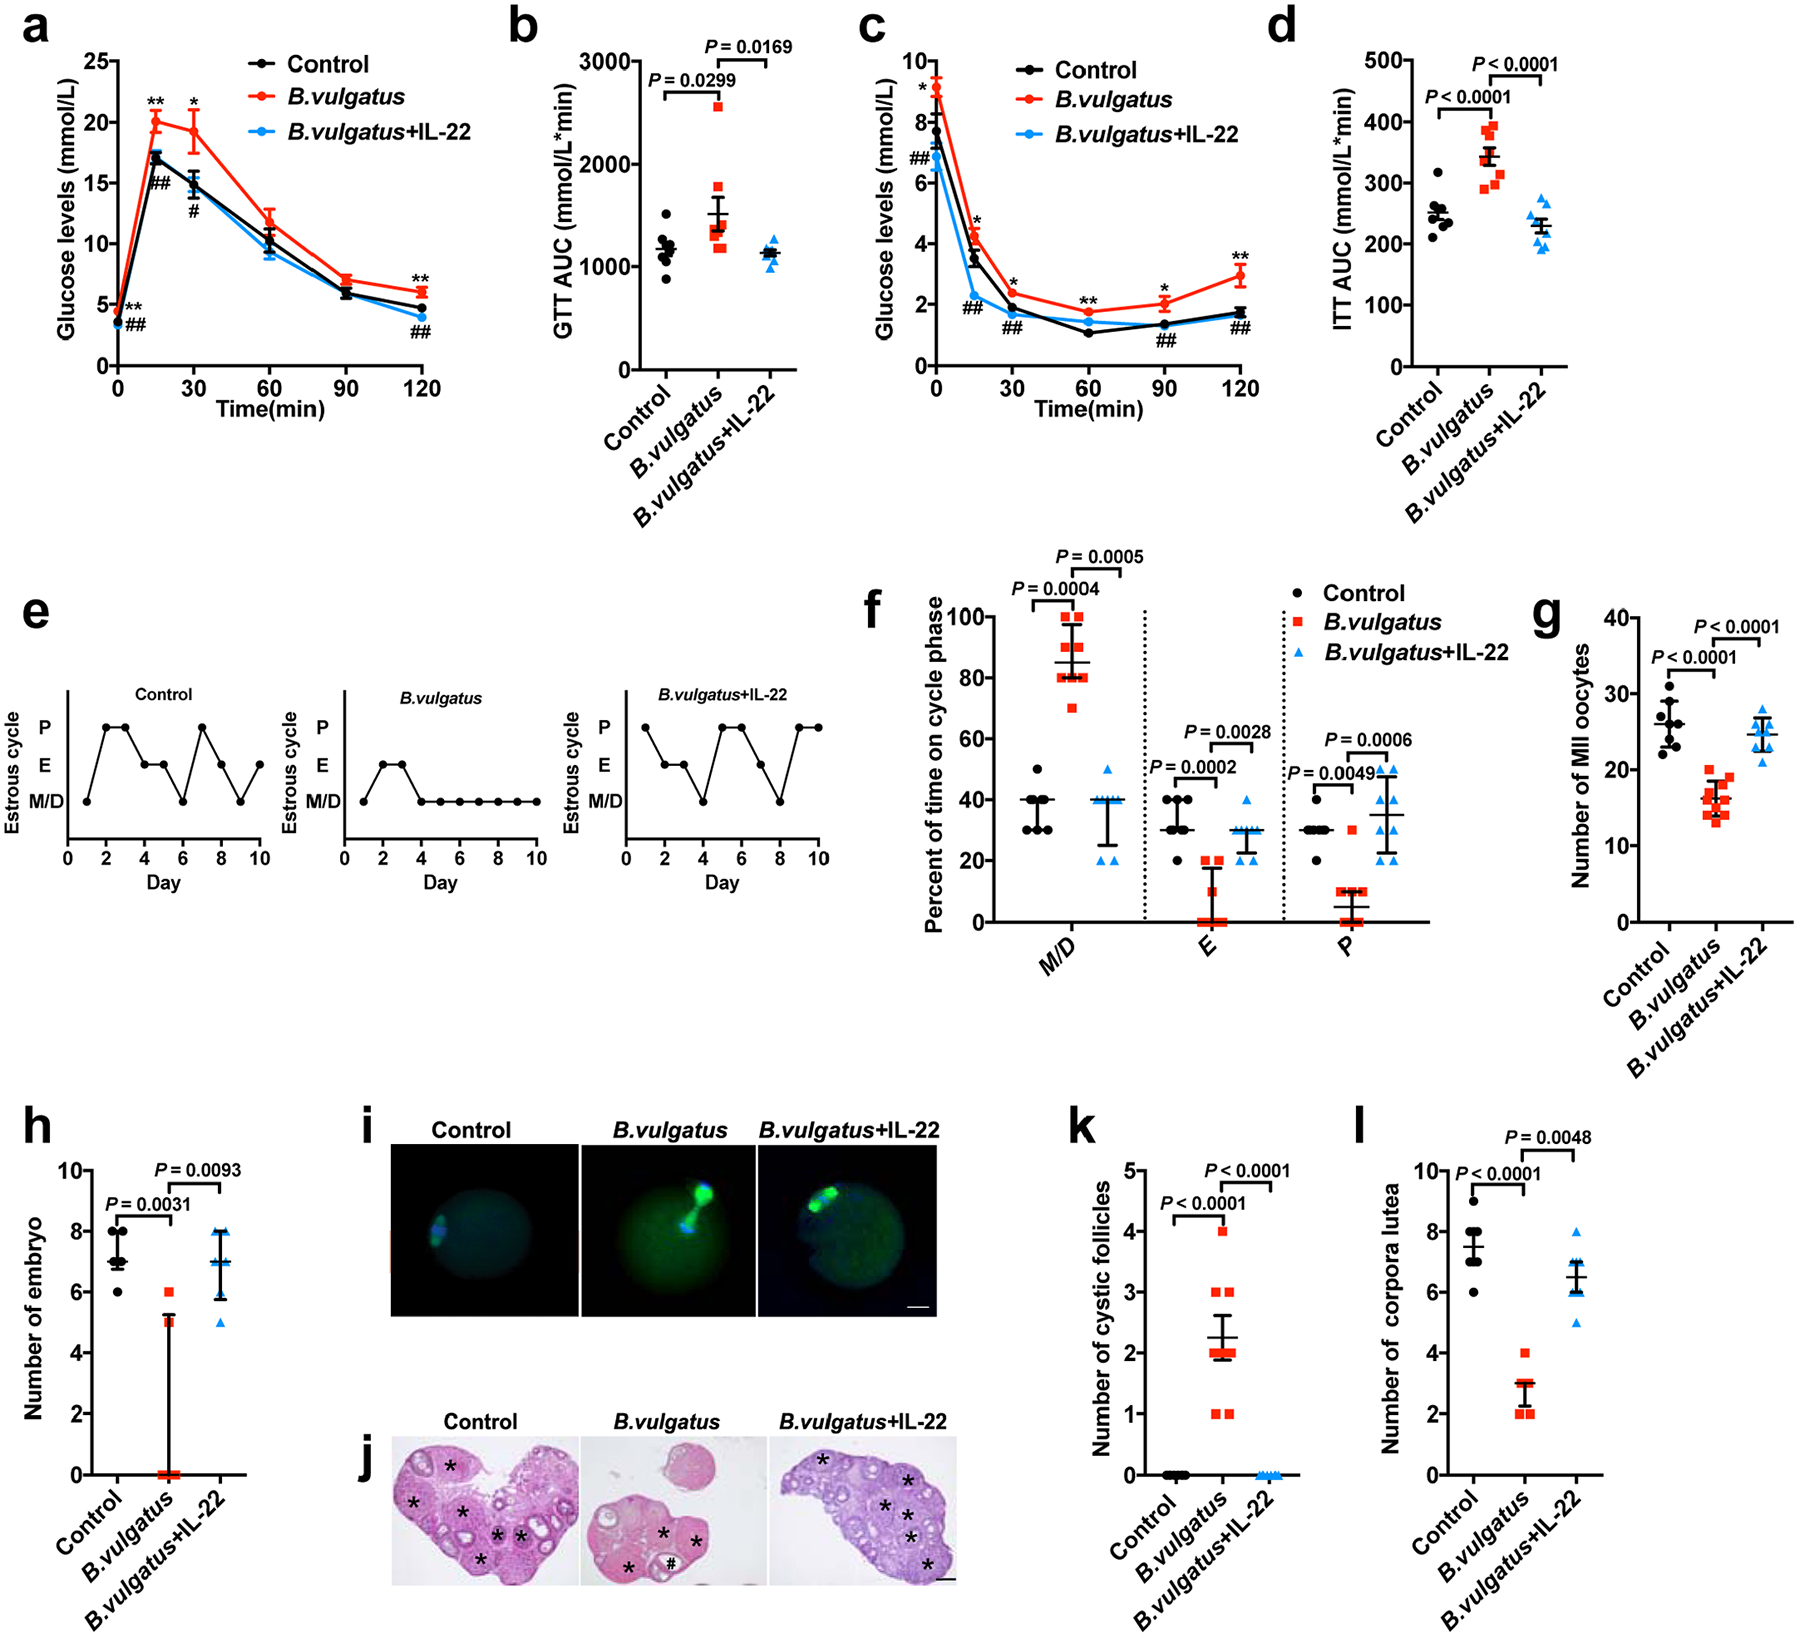
The mice were divided into three groups (control, B. vulgatus and B. vulgatus + IL-22). The animals were gavaged with B. vulgatus or heat-killed B. vulgatus as a control for 3 weeks. At the same time, the mice received IL-22 at a dose of 100 μg kg−1 d−1, intraperitoneally for the B. vulgatus + IL-22 group, or PBS as a parallel control for a–l. a, GTT (n = 8 mice per group). b, AUC of GTT (n = 8 mice per group; F2,21 = 4.076). c, ITT (n = 8 mice per group). d, AUC of ITT (n = 8 mice per group; F2,21 = 23.560; control versus B. vulgatus, P = 0.000036; B. vulgatus versus B. vulgatus + IL-22, P = 0.000002). e, Representative estrous cycles. f, Quantitative analysis of estrous cycles (n = 8 mice per group). g, Number of MII oocytes (n = 8 mice for the control and B. vulgatus + IL-22; n = 10 mice for B. vulgatus; F2,23 = 40.993; control versus B. vulgatus, P = 2.71 × 10⁻⁸; B. vulgatus versus B. vulgatus + IL-22, P = 3.40 × 10⁻⁷). h, Number of embryos (n = 6 mice per group). i, Immunofluorescence staining for tubulin (green) and DNA (blue) in MII oocytes (MII oocyte number = 150; n = 8 mice for the control and B. vulgatus + IL-22; n = 10 mice for B. vulgatus). Scale bars: 20 μm. Images are representative of two independent experiments with similar results. j, H&E staining of representative ovaries. Scale bars: 200 μm. Images are representative of three independent experiments with similar results. k, Quantitative analysis of cystic follicles (n = 8 mice per group; F2,21 = 37.800; control versus B. vulgatus, P = 2.14 × 10⁻⁷; B. vulgatus versus B. vulgatus + IL-22, P = 2.14 × 10⁻⁷). l, Quantitative analysis of CLs (n = 8 mice per group; control versus B. vulgatus, P = 0.000045). For a–d, g and k, P values were determined by one-way ANOVA with Tukey’s multiple comparison post-hoc test and data are presented as means ± s.e.m. For f, h and l, P values were determined by the Kruskal–Wallis test followed by Dunn’s post-hoc test and data are presented as medians with interquartile ranges. *P < 0.05; **P < 0.01 versus the control. #P < 0.05; ##P < 0.01 versus B. vulgatus.