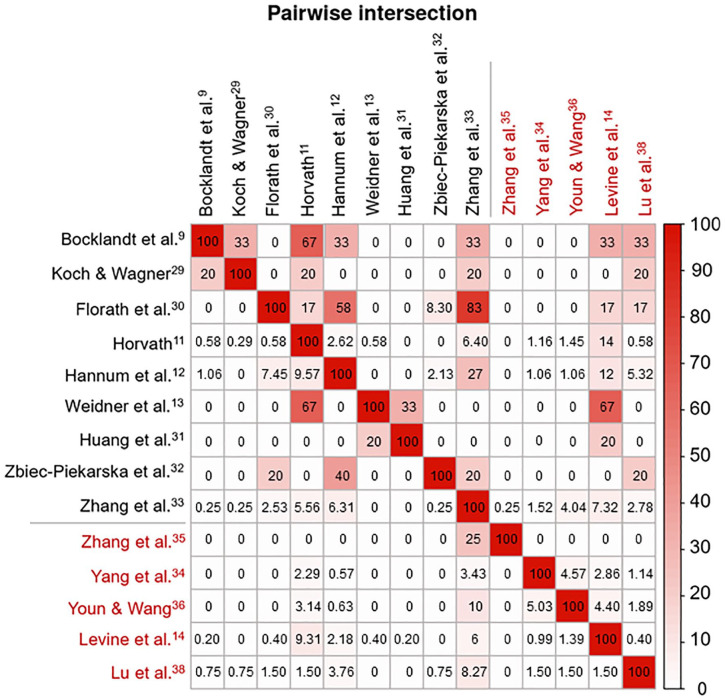
Figure 2.
Gene-overlap among the 14 DNAm clocks. Matrix of pairwise intersections illustrating the relationship between different DNAm clocks based on the percentage of overlapping genes (biological DNAm clocks are indicated in red and chronological clocks in black). Each pairwise intersection, which matches 2 of the variables displayed on the horizontal and vertical axes, was calculated as the percentage of overlap between the genes of the different DNAm clocks and ranges from 0% to 100%. Colour depth indicates the strength of the relationship. Plot generated using the pairwise module of the Intervene Shiny App.53

