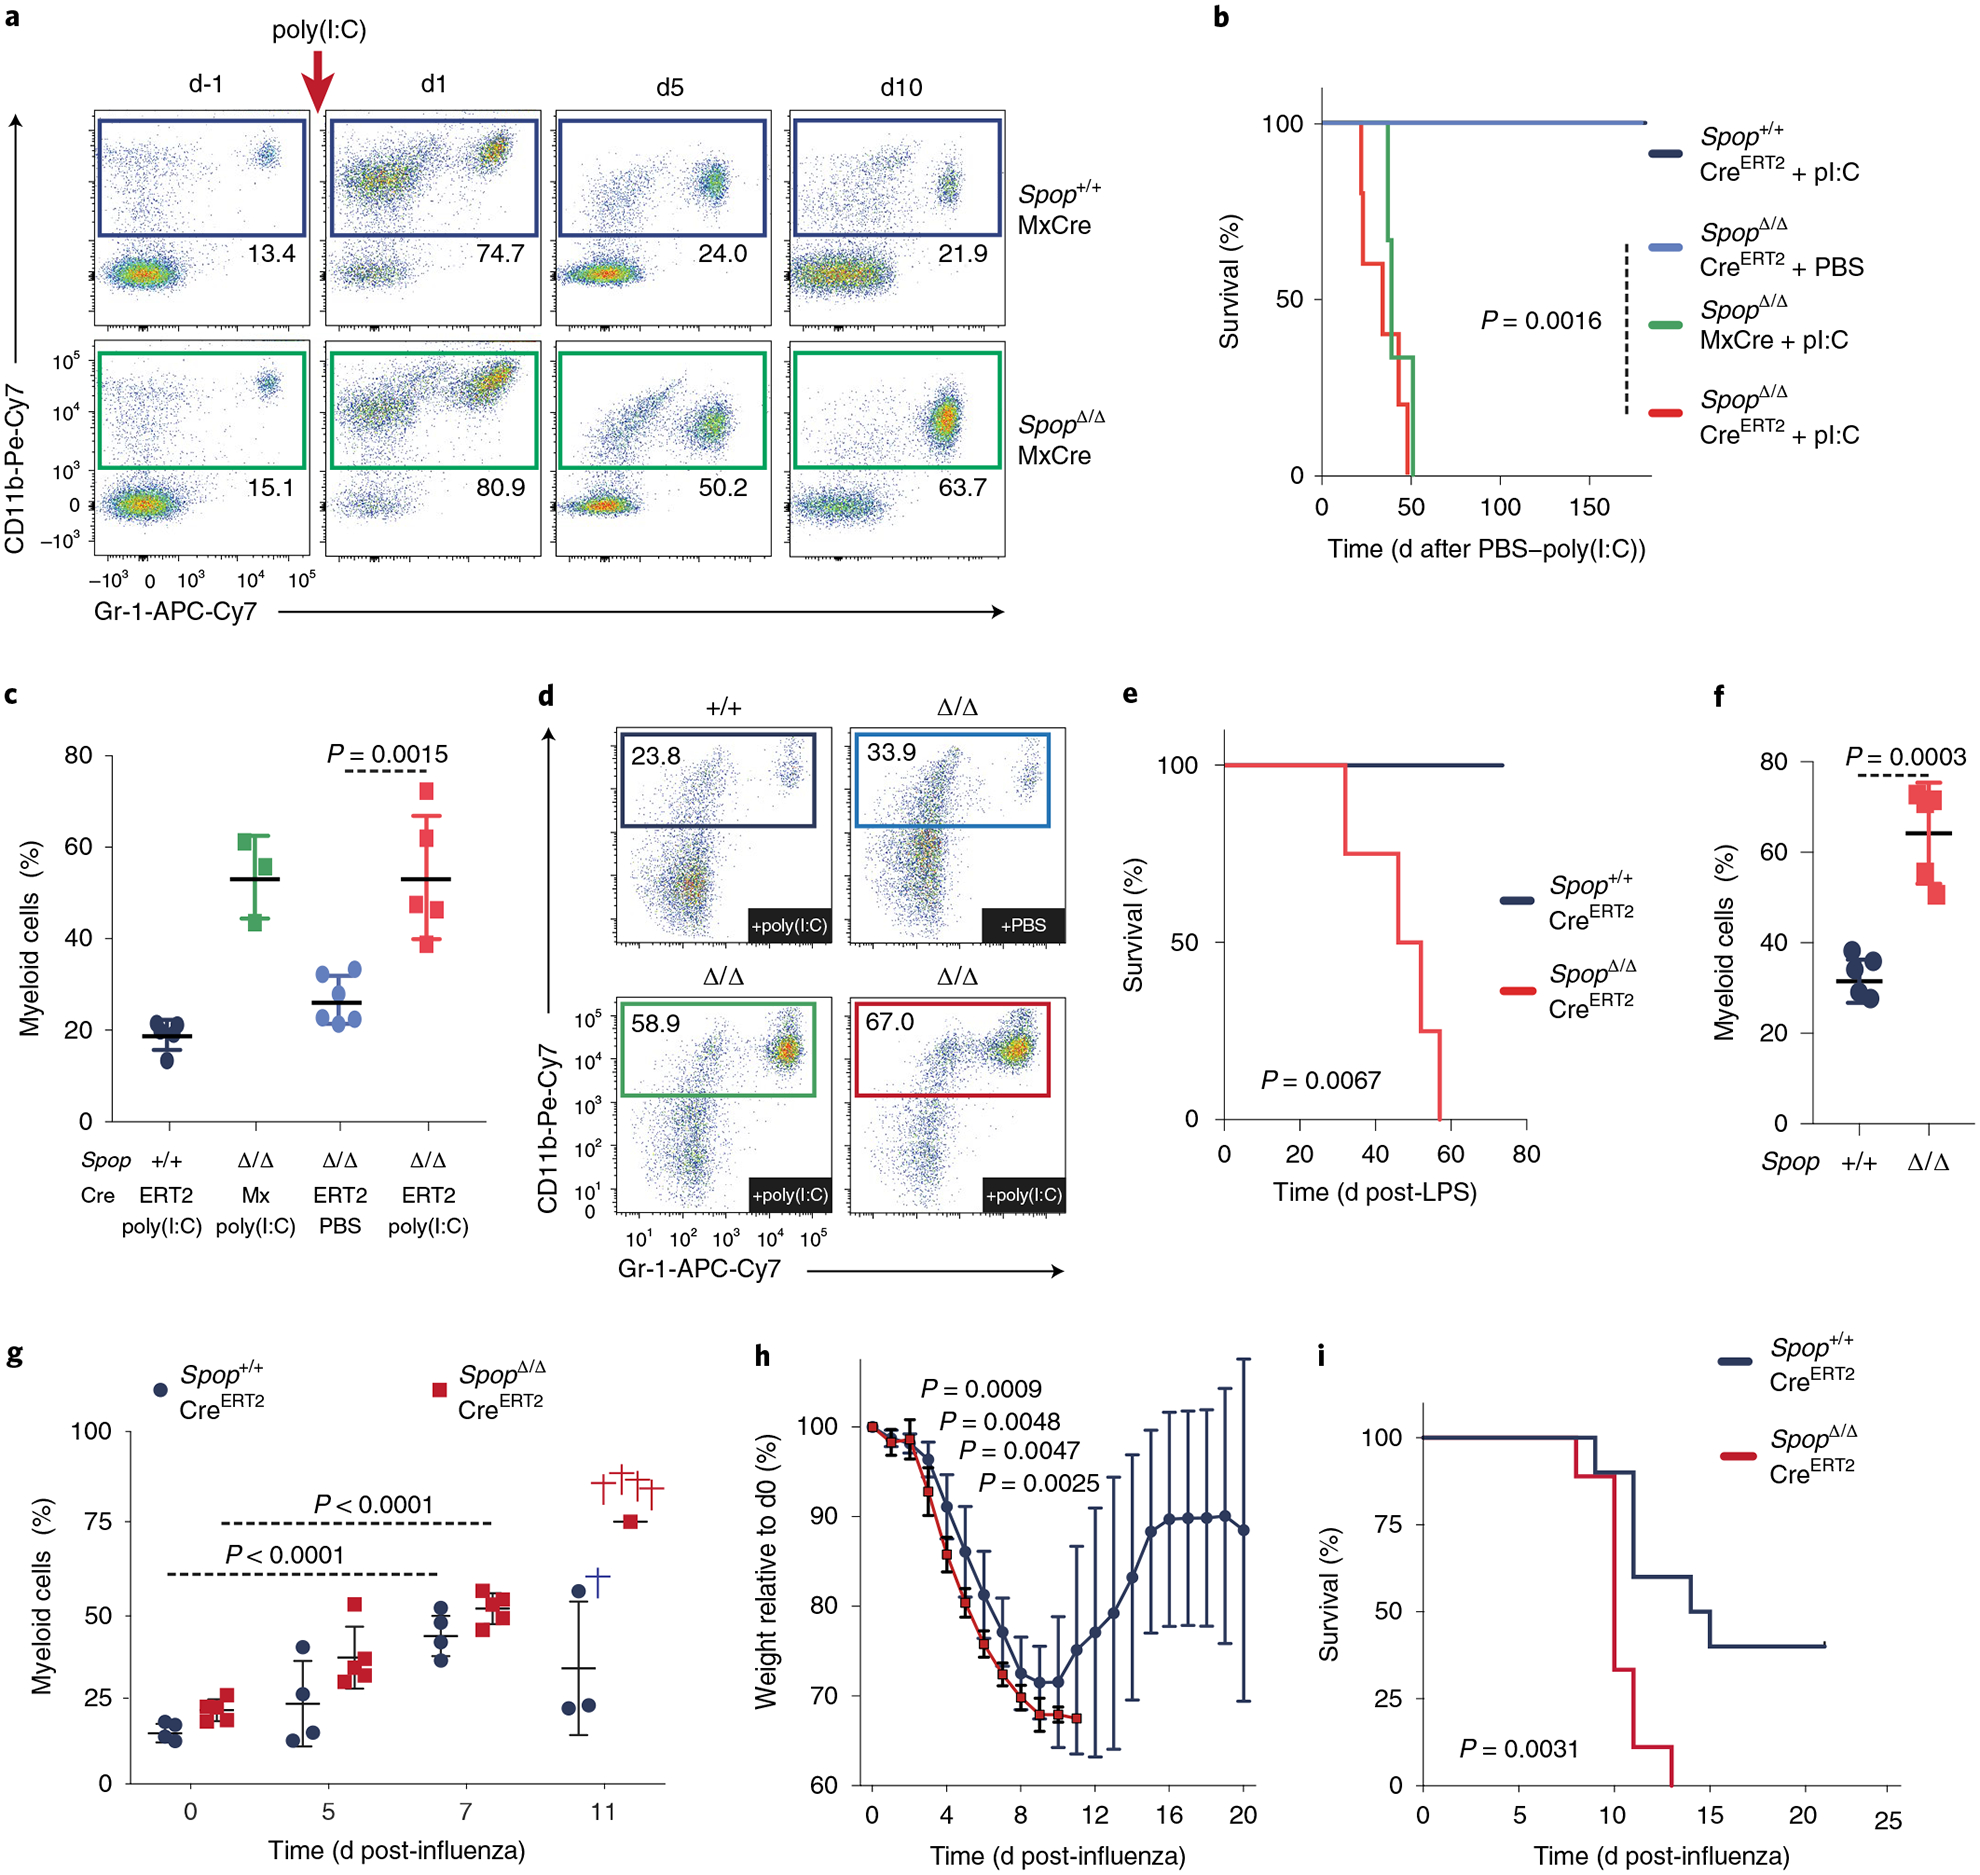
Fig. 2 |. Inflammation triggers dysregulated host response and fatal neutrophilia in Spop-deficient animals.

a, Representative flow cytometry analysis plots of the proportion of myeloid (CD11b+Ly6G+) cells in the peripheral blood of Spop KO and WT mice at the indicated times after poly(I:C) injection. b, Kaplan–Meier analysis of survival of the indicated mice after a single poly(I:C) injection (n = 5 per genotype except for SpopΔMxCre, which is n = 3; statistical analysis: Mantel–Cox test). c, Percentage of myeloid (CD11b+Gr-1+) cells in the peripheral blood of Spop KO and control hematopoietic chimeras on d15 after poly(I:C) or PBS injection (n = 5 except for SpopΔ/ΔMxCre, which is n = 3). d, Representative flow cytometry analysis plots of the proportion of myeloid (CD11b+Ly6G+) cells in the peripheral blood of the indicated hematopoietic chimeras on d15 after poly(I:C) or PBS injection. e, Kaplan–Meier analysis of survival of the indicated hematopoietic chimeras after a sublethal LPS injection (n = 4; statistical analysis: Mantel–Cox test). f, Percentage of myeloid (CD11b+Ly6G+) cells in the peripheral blood of the indicated mice on d15 after a sublethal LPS injection (n = 4). g, Percentage of myeloid (CD11b+Gr-1+) cells in peripheral blood of Spop KO CreERT2 (n = 5) and control (n = 4) hematopoietic chimeras at the indicated days after intranasal influenza inoculation. h, Percentage of weight loss of Spop KO CreERT2 (n = 9) and control (n = 10) hematopoietic chimeras after intranasal influenza inoculation. i, Kaplan–Meier analysis of survival of the indicated mice after intranasal influenza inoculation (n = 10). a–i, Data are representative of three independent experiments. Data for c and f–h represent mean ± s.d. Statistical analysis for c and f–h: unpaired Student’s t-test (two-tailed).
