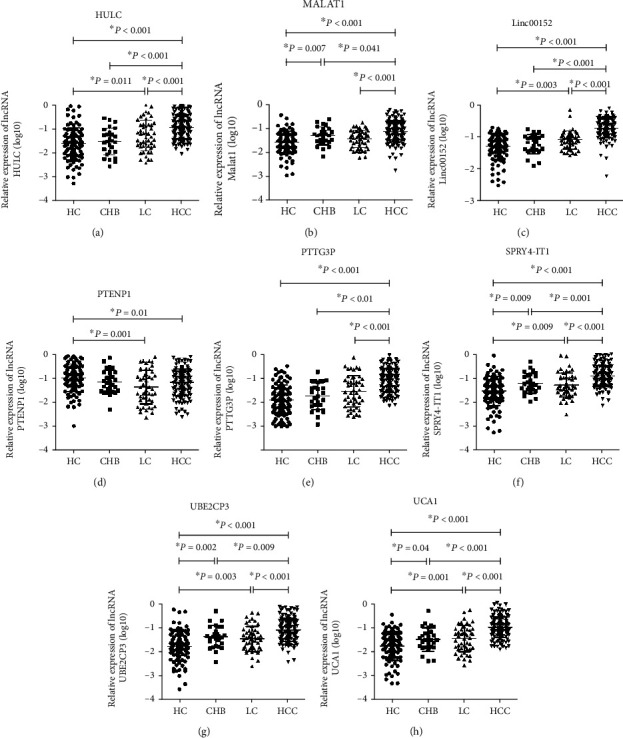
Figure 1.

The levels of eight serum lncRNAs in patients with HCC, CHB, LC and healthy controls. The relative expression levels of lncRNAs HULC (a), MALAT1 (b), Linc00152 (c), PTENP1 (d), PTTG3P (e), SPRY4-IT1 (f), UBE2CP3 (g), and UCA1 (h) in the serum of patients with HCC (n = 129), CHB (n = 27), LC (n = 49), and healthy controls (n = 93) by qRT-PCR. Circulating lncRNA expressions were calculated using 2−ΔΔCt method. GAPDH was used as a normalization control. Data of relative expression of serum lncRNAs fitted normal distribution after log10 transformation, and thus, the independent t-test was applied for comparisons between groups.
