Figure 4.

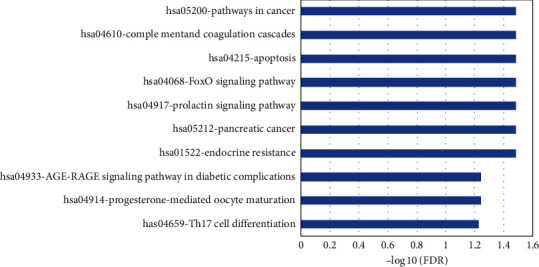
KEGG pathway analysis of putative target genes. X-axis represents negative log 10 of false discovery rate (FDR) adjusted p value while y-axis demonstrates the enriched KEGG pathways with ID and name.

KEGG pathway analysis of putative target genes. X-axis represents negative log 10 of false discovery rate (FDR) adjusted p value while y-axis demonstrates the enriched KEGG pathways with ID and name.