Figure 5.

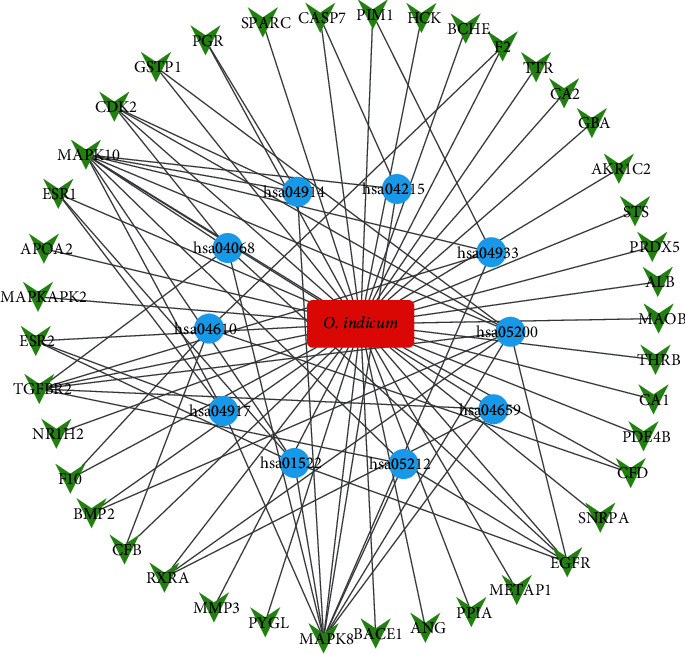
O. indicum-target-pathway network. The red oblong, green invert triangles, and blue circles indicate drug, target genes, and related pathways, respectively.

O. indicum-target-pathway network. The red oblong, green invert triangles, and blue circles indicate drug, target genes, and related pathways, respectively.