
Figure 2.
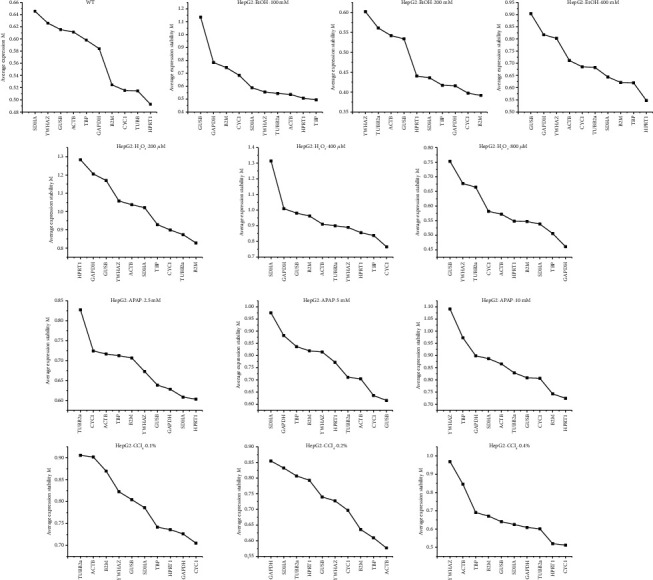
Expression stability of the reference genes in HepG2 evaluated by geNorm M values represents the average expression stability. From left to right, the value of M decreased in turn, indicating the stability gradually increased. Smaller M value means higher stability. The control group, ethanol, hydrogen peroxide, acetaminophen, and carbon tetrachloride were abbreviated to WT, EtOH, H2O2, APAP, and CCl4, respectively.