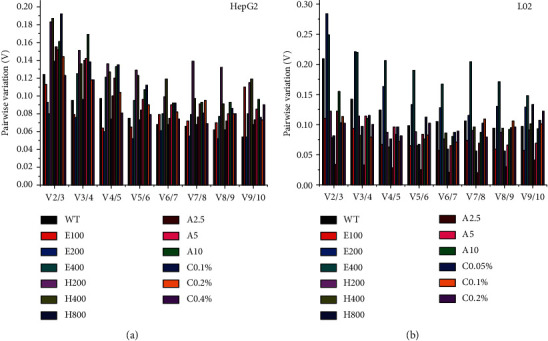
Figure 3.

Calculation of the optimal number of reference genes for quantitative analysis using geNorm. Pairwise variation (Vn/n + 1) of reference genes analyzed in different treatments was listed in (a, b) set the cut-off threshold value 0.15, calculating the optimal number of reference genes for precise quantitative in this work. WT, E100 (E200, E400), H100 (H200, H400, H800), A2.5 (A5, A10), and C0.05% (C0.1%, C0.2%, C0.4%), respectively, were the abbreviation for the control group, EtOH-100 mM (200 mM, 400 mM), H2O2-100 μM (200 μM, 400 μM, 800 μM), APAP-2.5 mM (5 mM, 10 mM, 20 mM), CCl4-0.05% (0.1%, 0.2%, 0.4%).
