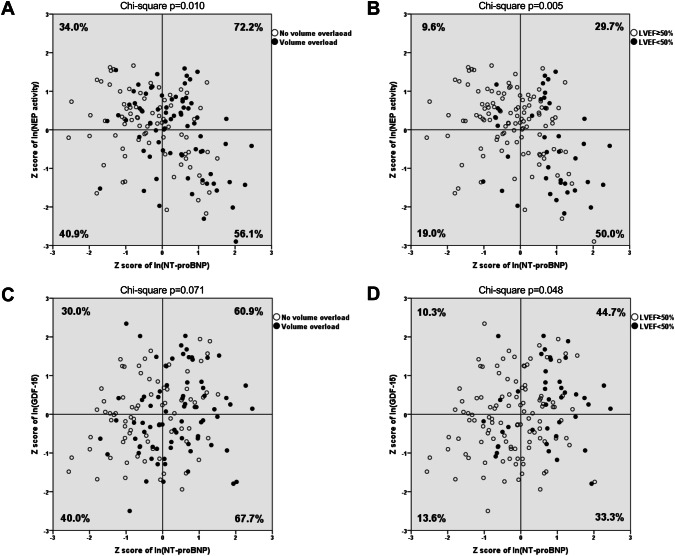
Fig. 2.
Distribution of volume overload (a + c) and systolic dysfunction (LVEF < 50%) (b + d) according to the circulating concentrations of NT-proBNP and either cNEP activity (a + b) or GDF-15 (c + d). Values of NT-proBNP, cNEP activity, and GDF were naturally log-transformed and sex-standardized. Groups were divided into quadrants according to the medians of resulting Z scores (represented by lines). Percentages refer to the prevalence of volume overload (a + c) and LVEF < 50% (b + d) per quadrant

