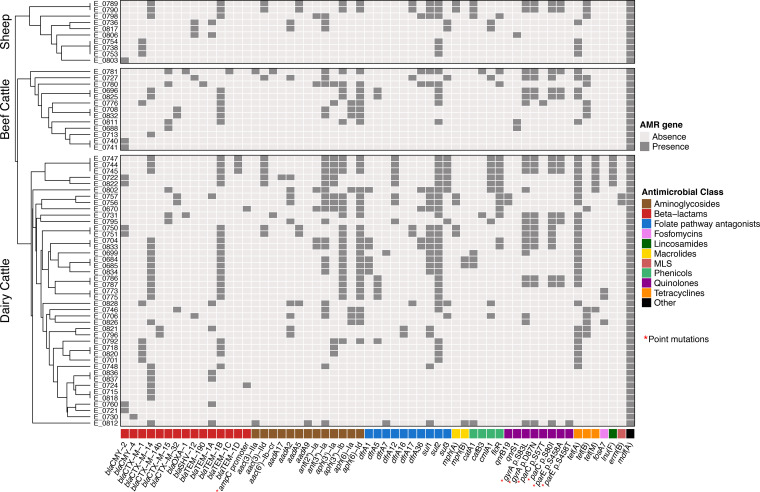
FIG 2.
Heat map showing the distribution of AMR genes detected by WGS in each isolate stratified by production system. Within each production system, samples were grouped based on their antimicrobial resistance pattern according to the result of the hierarchical clustering using the average linkage method (UPGMA) on the Euclidean distance matrix. Genetic determinants of resistance are grouped according to their corresponding antimicrobial classes, which are color coded. Point mutations are indicated by red asterisks.

