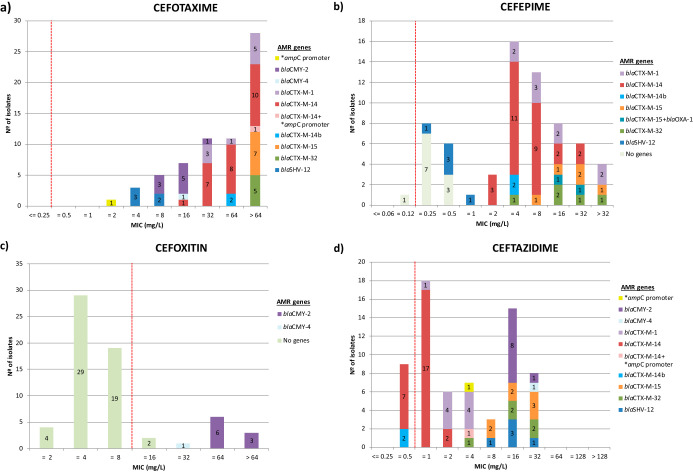
FIG 3.
Bar plots illustrating the phenotypic and genotypic characterization of resistance to the β-lactams cefotaxime (a), cefepime (b), cefoxitin (c), and ceftazidime (d). Numbers within the stacked bar plots indicate the number of isolates observed with a particular MIC and genotype. ECOFF values are indicated with red dashed lines. Point mutations are indicated by asterisks. “No genes” refers to those isolates lacking any genetic determinant of resistance for the corresponding antimicrobial.

