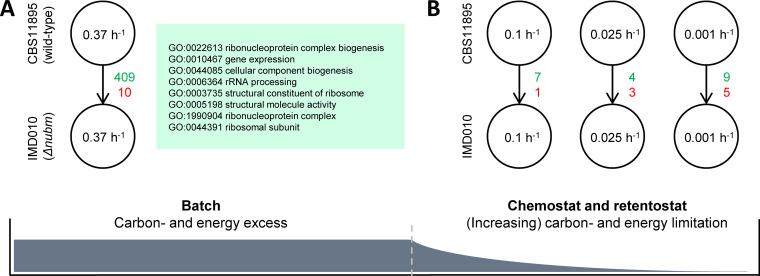
FIG 5.
Transcriptional response of O. parapolymorpha to a lack of functional respiratory complex I. Green (upregulated) and red (downregulated) numbers indicate how many genes were found significantly differentially expressed (absolute log2 fold change of >2; FDR < 0.001) in strain IMD010 (disrupted complex I Nubm subunit) compared to levels in strain CBS11895 (wild type) in glucose-grown batch cultures (A) and glucose-limited chemostat (0.1 and 0.025 h−1) and late-stage retentostat cultures (0.001 h−1) (B). Boxed in green are the most highly enriched GO terms within the set of upregulated genes in IMD010 under batch conditions (based on 275 out of 409 genes for which an S. cerevisiae ortholog could be identified) (see Table S2 in the supplemental material for an extended list). Numbers inside circles represent the specific growth rate/dilution rate of the different cultures.

