
FIG 1.
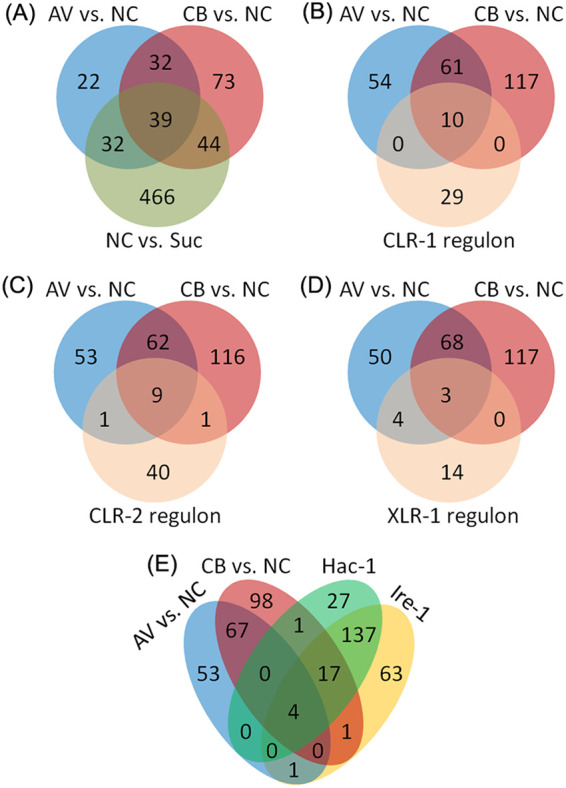
Venn diagram analysis comparing proteins affected by alternate carbon sources. (A) Comparison of proteins that increased in abundance upon exposure to cellobiose (CB) versus no carbon (NC), upon exposure to Avicel (AV) versus NC, and under carbon starvation (NC versus Suc). (B to E) Comparison of proteins that increased in abundance by exposure to cellobiose or Avicel with the targets of the CLR-1 direct regulon (B), the CLR-2 direct regulon (C), the XLR-1 direct regulon (D), or the Ire-1/HAC-1 regulon (E). Quantification of proteins was performed with a P value of <0.05.