Fig. 2.
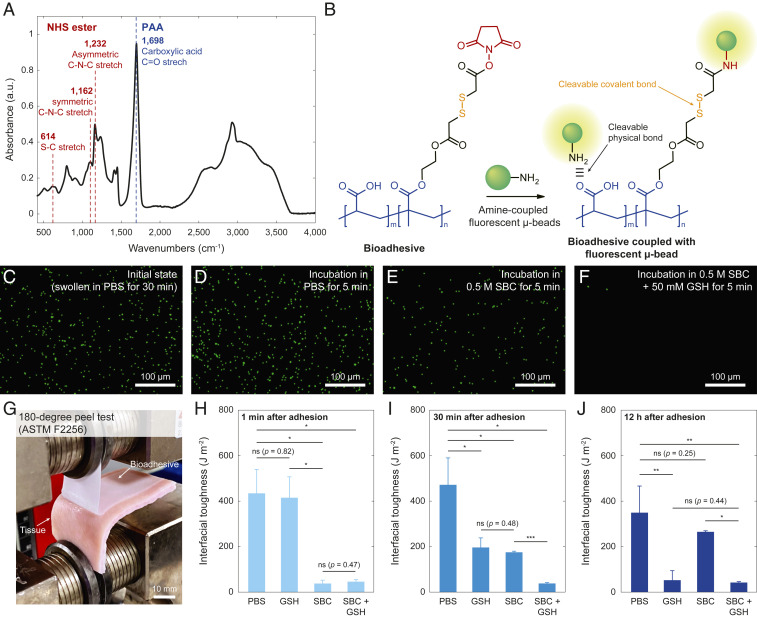
Triggerable detachment of the bioadhesive. (A) FTIR spectra of the bioadhesive with associated peaks for carboxylic acid (1,698 cm−1), disulfide (614 cm−1), and NHS ester (1,162 and 1,232 cm−1) functional groups. a.u., arbitrary unit. (B) Schematic illustrations for validation of triggerable detachment based on fluorescent primary amine-coupled microbeads. (C–F) Fluorescent microscope images for the bioadhesive sample in the initial state (C), 5 min after incubation in PBS (D), PBS with 0.5 SBC (E), and PBS with 0.5 M SBC and 50 mM GSH (F). (G) Photograph of 180° peel test setup for the measurement of interfacial toughness. (H–J) Interfacial toughness between the bioadhesive and wet porcine skin tissues 5 min after applying various solutions in short-term (H), intermediate-term (I), and long-term (J) adhesion. Values in H–J represent the mean and the SD (n = 4). P values are determined by a Student’s t test. Scale bars are shown in the images. ns, not significant (P > 0.05). *P ≤ 0.05; **P ≤ 0.01.

