
Figure 1. Design and validation of hPSC-based multiplex analysis platform.
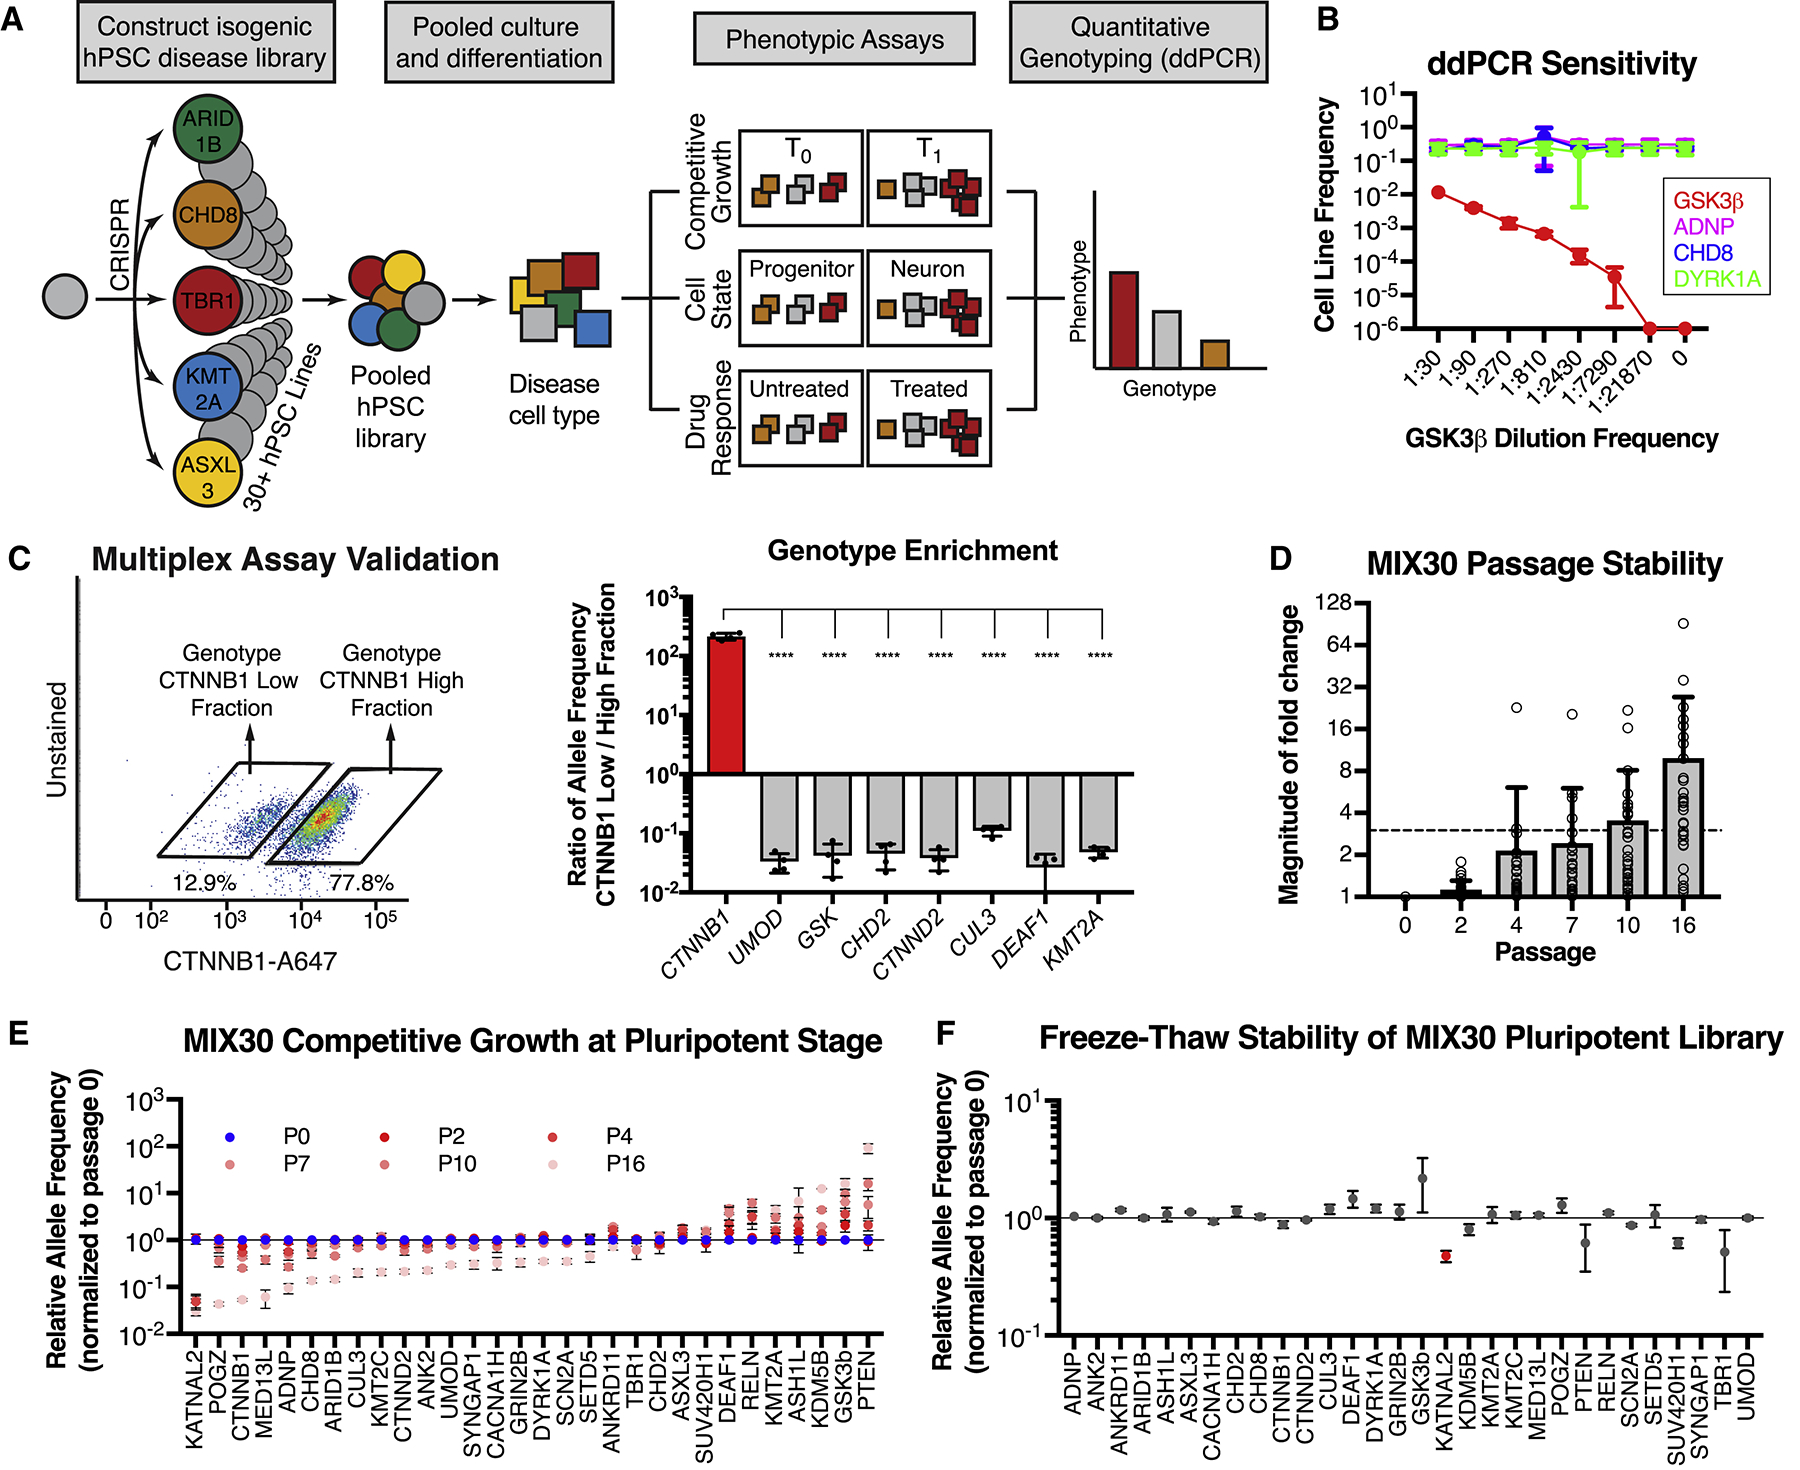
(A) Multiplex assay design. Individual disease-associated hPSC lines are generated using CRISPR/Cas9, pooled, and differentiated into a disease-relevant tissue. The pooled differentiation can be assayed for growth, cell-state, or drug-response phenotypes by determining relative allele frequencies for each line in comparison to an internal standard (negative control). For example, growth phenotypes are determined by measuring changes in allele frequency over time (T1 vs T0). Cell-state phenotypes are determined by measuring differences in allele frequency between physically separated populations (e.g. neurons versus progenitors separated via fluorescence activated cell sorting (FACS) or magnetic sorting (MACS), cells exposed (or not) to a given drug or cells separated based on migratory potential). Drug response phenotypes are determined by measuring differences in allele frequency between treated and untreated pools. Allele frequencies are measured using ddPCR. (B) ddPCR is a sensitive and accurate method to measure allele frequency, as determined by a serial dilution assay. ddPCR could detect the GSK3β line within a 4-line mixture until it reached a frequency between 1:7290 and 1:21870, using a read depth of ~15,000. n = 3 dilution series, mean ± S.D. (C) Validation of multiplex assay. A pool of 8 hPSC lines, including CTNNB1, UMOD, and GSK3β mutant lines, was separated into CTNNB1-low and CTNNB1-high expressing fractions using intracellular FACS with a CTNNB1 antibody. Each fraction was genotyped with ddPCR to calculate relative allele frequencies (allele frequency in sorted fraction / allele frequency in unsorted fraction). The CTNNB1 mutant line was enriched in the CTNNB1-low fraction while all other lines were depleted in this fraction. Graph depicts mean ± S.D. dots represent individual multiplex assays. One-way ANOVA followed by Dunnett’s test. **** p < 0.0001. n = 4 independent trials. (D) Average magnitude of allele frequency fold change in MIX30 library, normalized to passage 0, remained < 3x for 7 passages. Individual data points represent average fold change per line across MIX30 pools (n = 3). Mean ± S.D., dots represent individual lines within pooled cultures. (E) Competitive growth dynamics of all lines in MIX30 library at pluripotency stage. Lines with selective growth advantage (e.g. PTEN and GSK3β) appear to suppress growth of most other lines by passage 16. n = 3 MIX30 pools, mean ± S.E.M. (F) Allele frequencies measured one day after thawing are largely unaffected by freeze-thaw cycle. Graph depicts mean ± S.E.M, two-sided t-test using Benjamini-Hochberg method for multiple comparison. Red indicates line with significantly reduced allele frequency (FDR < 0.05). n = 3 MIX30 pools. ddPCR, droplet digital PCR. See also Figure S1 and Table S1.