
Figure 2. Deriving human prefrontal cortex-like tissue from hPSCs.
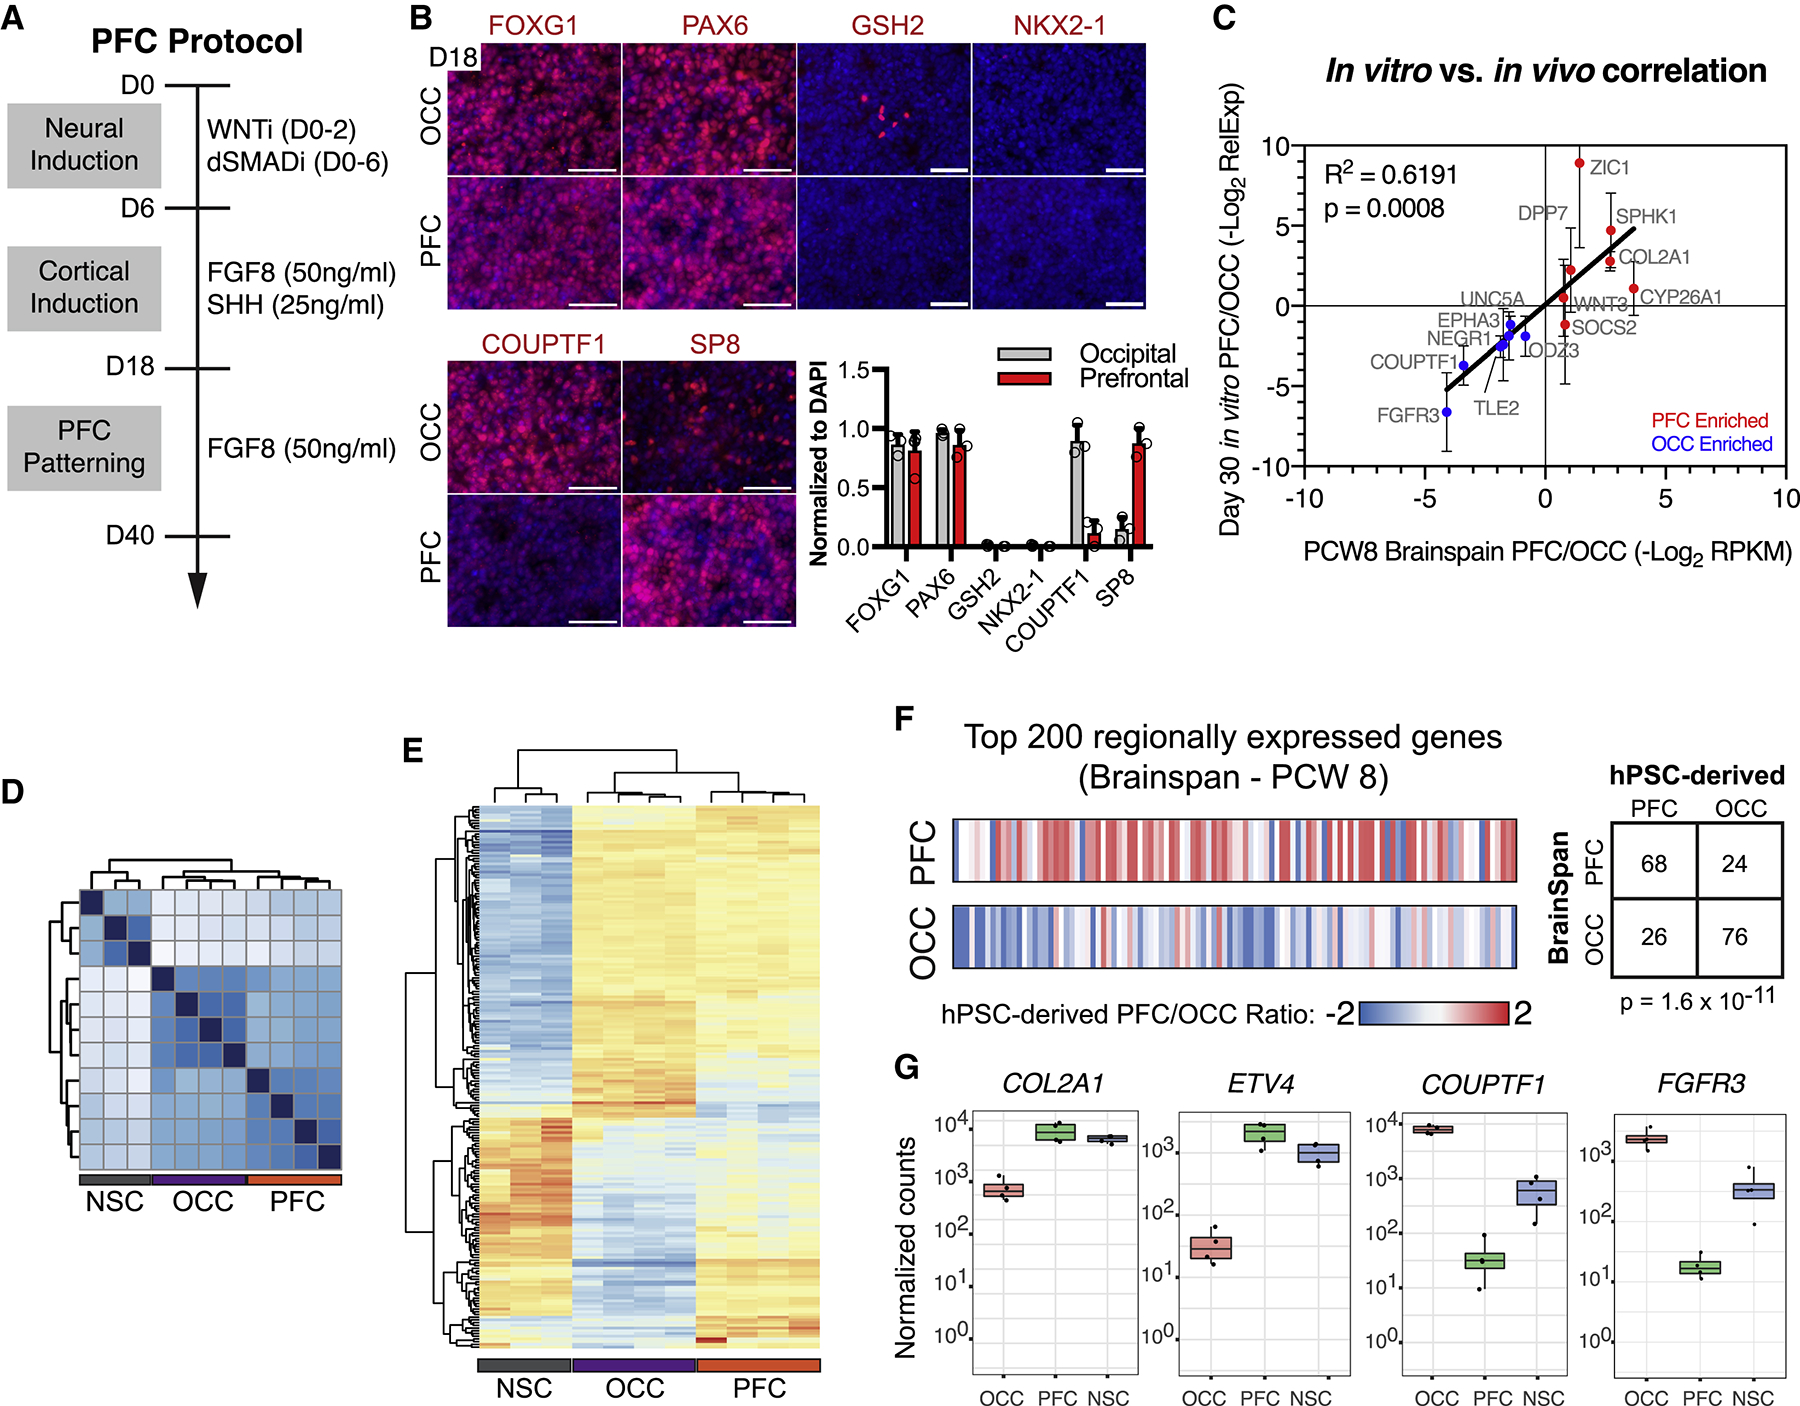
(A) Schematic illustration for hPSC-derived PFC cultures. (B) PFC and OCC cultures express appropriate regional markers, assessed by immunocytochemistry. FOXG1+/PAX6+/GSH2−/NKX2.1- indicates general cortical identity. FOXG1 (PFC, 81.6±16.1%; OCC, 86.5±8.5%), PAX6 (PFC, 86.5±11.2%; OCC, 96.9±3.3%), GSH2 (PFC, 0.0±0.0%; OCC, 1.0±0.9%) and NKX2.1 (PFC, 0.0±0.0%; OCC, 0.1±0.1%). SP8 and COUPTF1 are PFC and OCC markers, respectively. SP8 (PFC, 88.0±12.4%; OCC, 15.0±10.0%), COUPTF1 (PFC, 12.0±10.8%; OCC, 90.3±12.9%). Graph depicts mean ± S.D., dots represent individual differentiations. n = 3 differentiations. (C) Differential transcript expression of 14 genes between human fetal PFC and OCC, defined using BrainSpan transcriptional atlas (see methods), were highly correlated in vitro and in vivo, R2 = 0.6191, p = 0.0008; n = 5 differentiations, mean ± S.D. (D) Unsupervised clustering of RNA-seq data from NSC, OCC, and PFC cultures. (E) Unsupervised clustering of differentially expressed genes between NSC, OCC, and PFC cultures. (F) Ratio of hPSC-derived PFC to OCC gene expression for the top 200 genes more highly expressed in human fetal PFC versus OCC (top row) and the top 200 genes more highly expressed in human fetal OCC versus PFC (bottom row). Chi-squared p = 1.6×10⁻¹¹, n = 4 PFC and OCC differentiations each. (G) Four examples of genes with differential gene expression from RNA-seq analysis. dSMADi, dual-SMAD inhibitors SB431542 and LDN193189; PCW, post-conception week; PFC, prefrontal cortex; OCC, occipital cortex; NSC, neural stem cell; WNTi, tankyrase inhibitor XAV939. Scale bars = 100 μm. See also Figure S2 and Table S2.