
Figure 3. Multiplex analysis reveals functional subgroups of autism-associated mutations that dysregulate PFC neurogenesis.
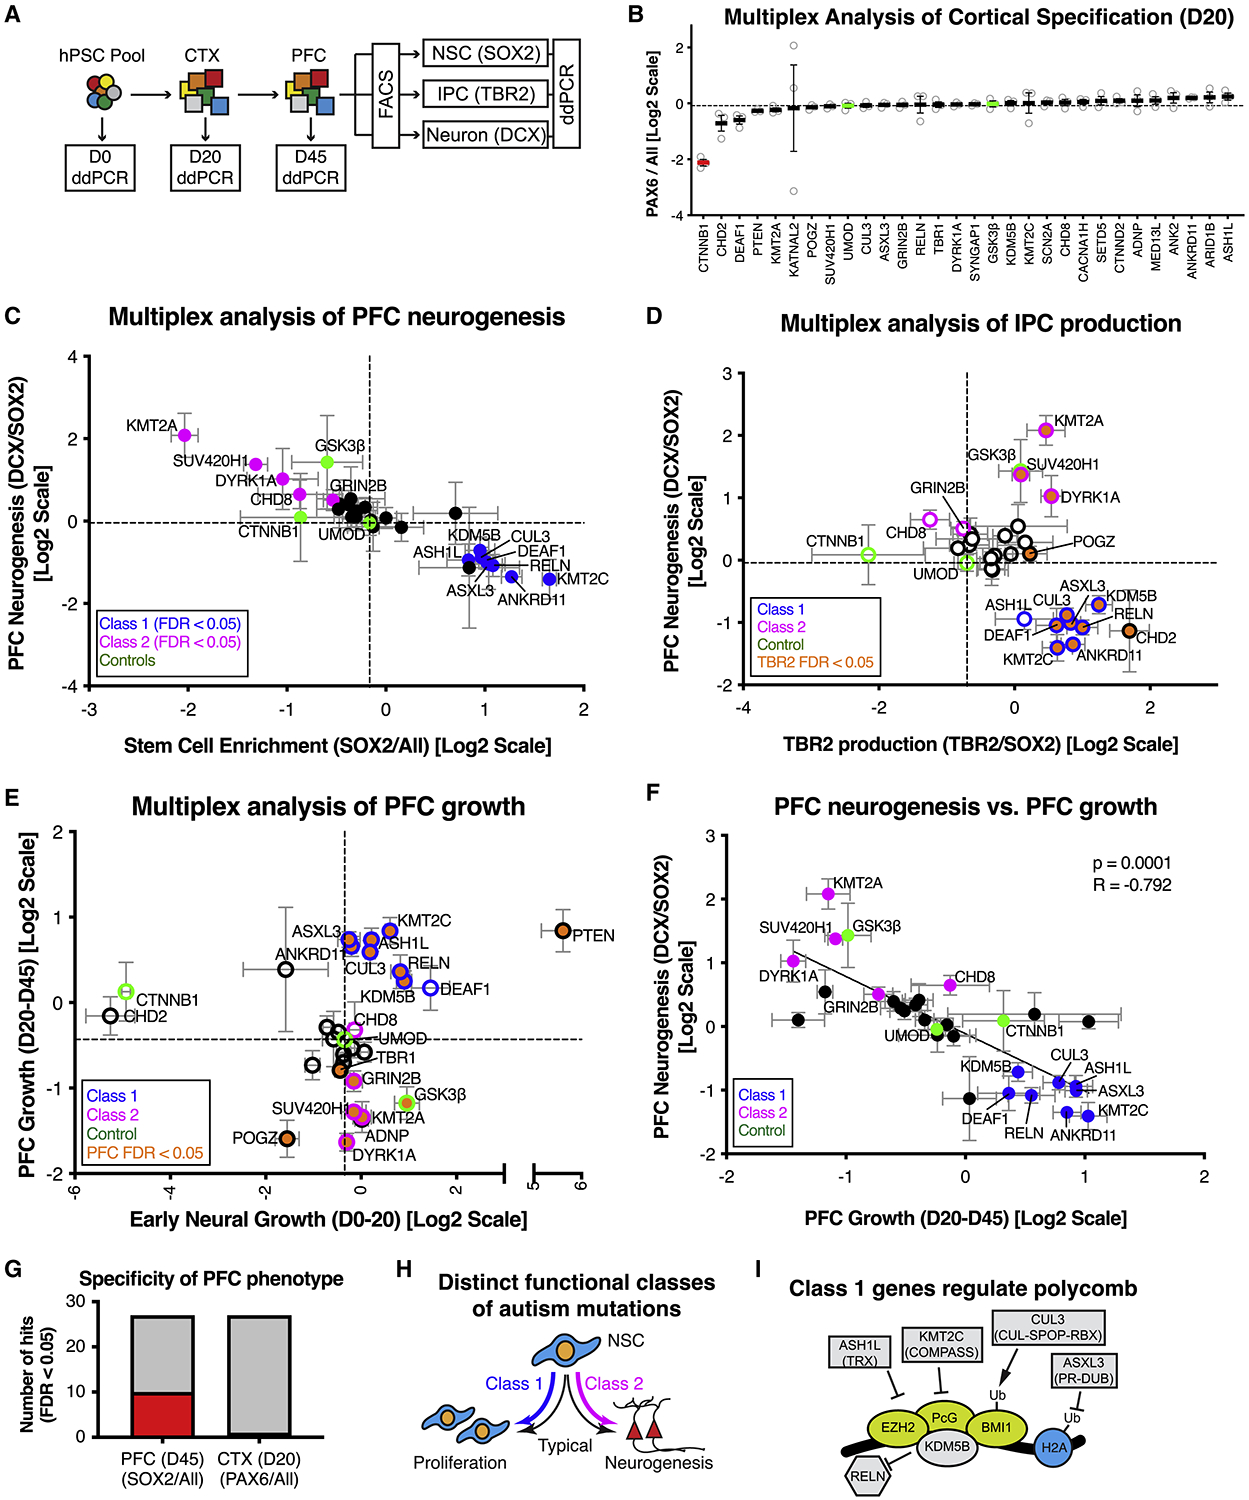
(A) Schematic illustration of multiplex strategy to test autism mutations for alterations in PFC growth and neurogenesis. Growth phenotypes are determined by measuring changes in allele frequency from D0 to D20 (early neural growth), and D20 and D45 (PFC growth). PFC neurogenesis phenotypes are determined by measuring changes in allele frequency between NSC (SOX2), IPC (TBR2), and Neuron (DCX) sorted fractions. (B) Multiplex assay testing each autism line for cortical specification. Average relative cell line enrichment in PAX6+ fraction, relative to an unsorted day 20 MIX30 fraction (ANOVA p < 0.0001). Red bars indicate cell lines with significant increases or decreases in enrichment score compared to UMOD (FDR < 0.05). Graph depicts mean ± S.E.M., dots represent individual differentiations. FDR calculated using Welch ANOVA with post-hoc comparison to UMOD, p values corrected using Benjamini, Krieger, Yekutieli method. n = 3 differentiations. (C) Scatter plot of multiplex neurogenesis assay showing changes in neuronal production (DCX/SOX2 ratio) and stem cell enrichment (SOX2/All ratio). Class 1 mutations (8/27, blue: FDR < 0.05) exhibit decreased neuronal production or increased stem cell enrichment. Class 2 mutations (5/27, magenta: FDR <0.05) exhibit increased neuronal production or decreased stem cell enrichment. n = 5 differentiations from three MIX30 pools. (D) Scatter plot of multiplex neurogenesis assay showing changes in IPC production (TBR2/SOX2 ratio) correlated with PFC neurogenesis phenotypes (DCX/SOX2 ratio), normalized to a negative control (UMOD). 7/8 Class 1 mutations (blue edge) exhibit increased IPC production (orange, FDR<0.05), while Class 2 (magenta edge) mutations are variable in IPC production phenotypes. n ≥ 3 differentiations from at least two MIX30 pools. (E) Scatter plot of multiplex assay showing competitive growth phenotypes during early neural (D20/D0 ratio) and PFC growth phases (D45/D20 ratio). 7/8 Class 1 mutations (blue edge) show increased PFC growth (orange, FDR<0.05) while 4/5 Class 2 mutations (magenta edge) exhibit decreased PFC growth (orange, FDR<0.05). n = 5 differentiations from three MIX30 pools. (F) Significant negative correlation between PFC neurogenesis and PFC growth parameters (r = −0.792, p=0.0001). For all scatter plots, FDR calculated using Welch ANOVA with post-hoc Benjamini, Krieger, Yekutieli method for multiple comparisons. Dotted lines demarcate negative control UMOD. (G) 10/27 cell lines exhibited a stem cell enrichment phenotype (SOX2/All) during PFC development at day 45, while 0/27 lines exhibited a neural induction phenotype (PAX6/All) during an earlier cortical development phase at day 20. Red and grey bars indicate number of cell lines with positive and negative phenotypes respectively. (H) Summary of class-specific PFC development phenotypes. NSC behavior is characterized by a balance between proliferation and neurogenesis (black arrows). Autism mutations skew this balance toward proliferation (Class 1, blue arrow) or neurogenesis (Class 2, magenta arrow). (I) Five of eight class 1 genes are known regulators of polycomb signaling. ASH1L is a trithorax group protein (Gregory et al., 2007), and KMT2C is a member of the COMPASS complex (Piunti and Shilatifard, 2016). ASXL3 is part of the Polycomb repressive deubiquitinase complex (Srivastava et al., 2016). CUL3 regulates polycomb through ubiquitination (Hernandez-Munoz et al., 2005). KDM5B occupies over 50% of polycomb sites (Schmitz et al., 2011). In addition, DEAF1 mutant mice have a homeotic transformation phenotype (Hahm et al., 2004). All error bars are mean ± S.E.M. Internal standards are colored green. CTX, cerebral cortex; D, day; ddPCR, droplet digital PCR; FACS, fluorescent activated cell sorting; hPSC; human pluripotent stem cell; NSC, neural stem cell; PFC, prefrontal cortex; IPC, intermediate progenitor cell. See also Figure S3 and Table S3.