
Figure 4. Validation of multiplex neurogenesis assay.
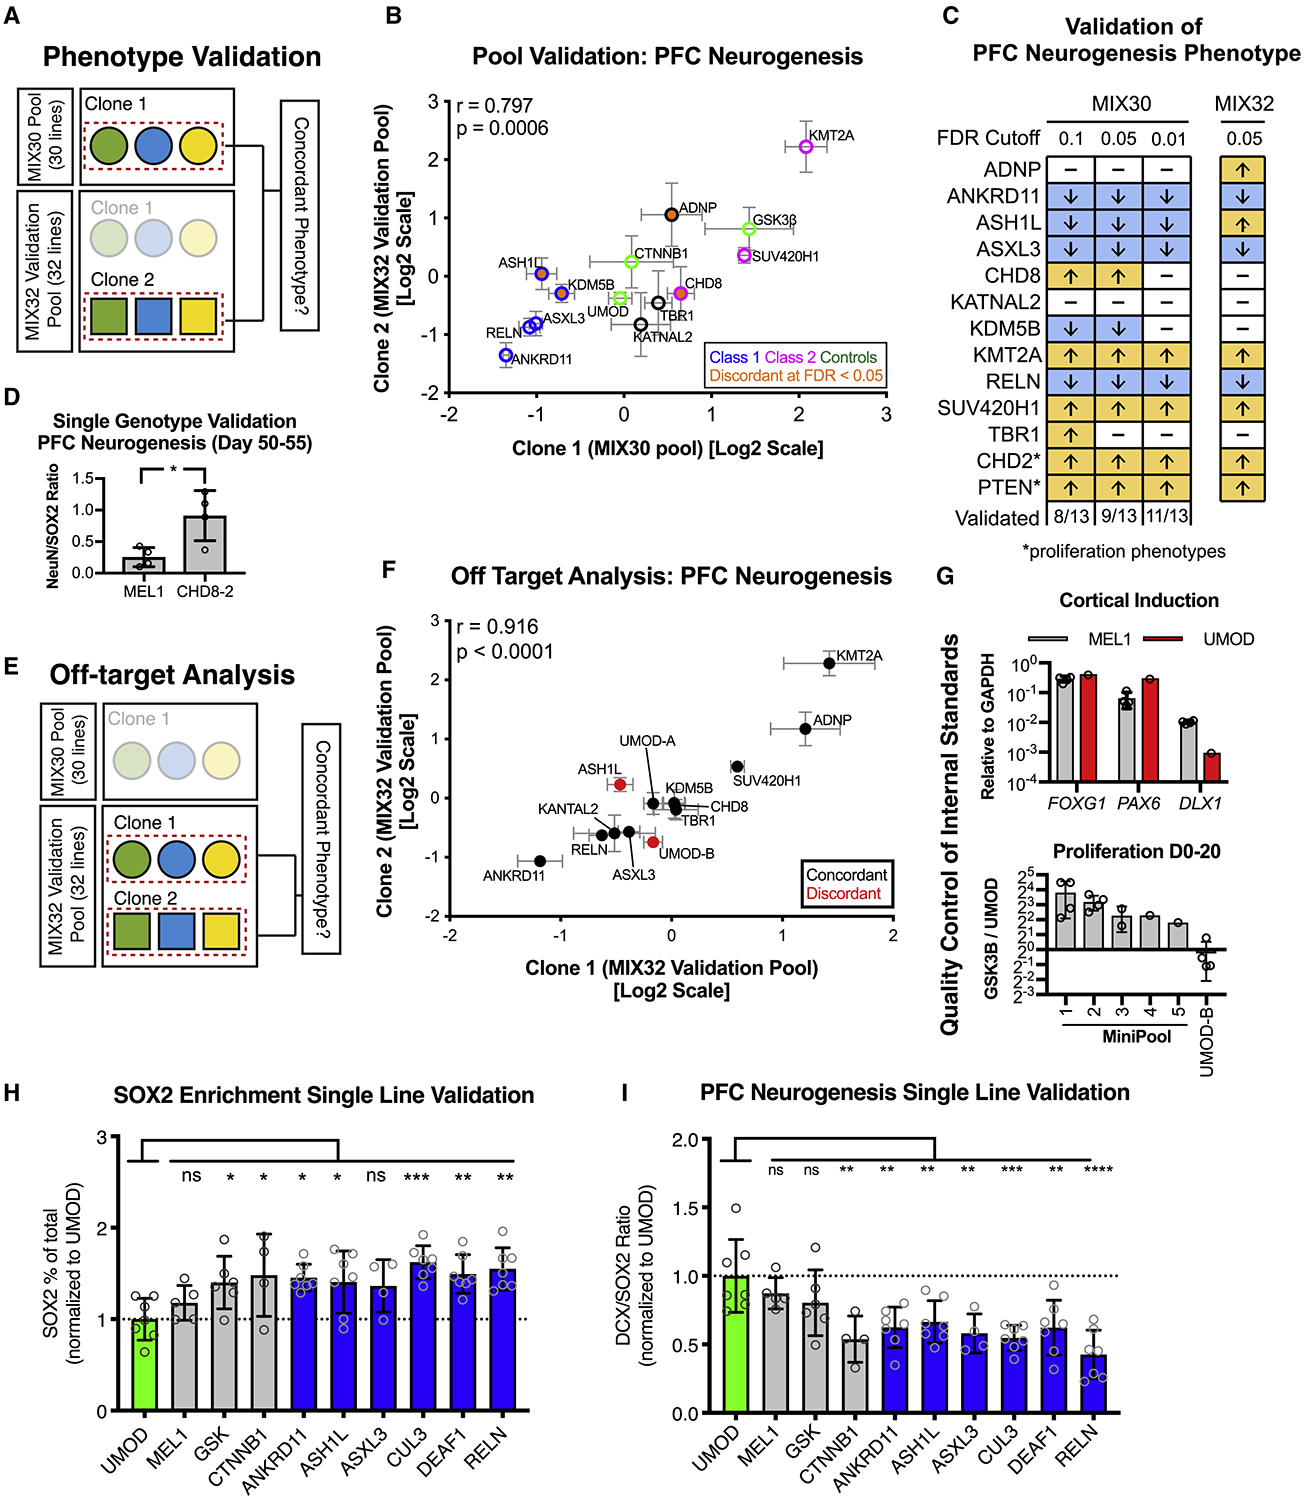
(A) Strategy for phenotypic validation using the MIX32 validation pool. The validation pool contains 13 pairs of autism clones, the first clone of each pair was from the original MIX30 pool, while the second was an independent clone. 9 independent clones were generated with distinct guide RNAs. A pool-based validation was performed in which the phenotype from the original MIX30 pool (clone 1) was compared to the phenotype of the independent clone (clone 2) from the validation pool. Pairs that showed discordance could then be tested in single line assays. (B) Scatter plot showing comparison of phenotypes between clone 1 (MIX30 pool) and clone 2 (validation pool). Overall correlation r = 0.797, p = 0.0006. Graph depicts mean ± S.E.M. Test pool n = 5 differentiations from three MIX30 pools, Validation pool n = 4 differentiations from three MIX32 pools. (C) Schematic comparing PFC neurogenesis phenotypes from the original MIX30 pool to the validation pool. Proliferation phenotypes are compared for CHD2 and PTEN. 9/13 clones validated using an FDR cut-off of 0.05. Increasing MIX30 FDR stringency to 0.01 increases validation rate to 11/13. Arrows represent direction of phenotype. FDR calculated using Welch ANOVA with post-hoc comparisons to UMOD, p-values corrected for multiple comparisons using Benjamini, Krieger, Yekutieli method. Test pool n = 5 differentiations from three MIX30 pools, Validation pool n = 4 differentiations from three MIX32 pools. (D) Testing of CHD8 clone 2 in a single genotype PFC differentiation shows increased ratio of NeuN/SOX2 compared to MEL1 control at day 45. Graph depicts mean±S.D., dots represent individual differentiations. Two-sided student t-test. * p = 0.022. MEL1 n = 4 differentiations, CHD8-2 n = 4 differentiations. (E) Strategy to quantify off-target rate in the MIX30 pool. A validation pool was generated that contains 15 pairs of clones, 13 autism-associated and 2 control pairs. One clone of each pair was from the original MIX30 pool, while the second clone of each pair is an independent clone. 9 independent clones were generated with distinct guide RNAs, 6 independent clones were generated with the same guide RNA. Off-target effects were determined by assessing phenotypic concordance using the multiplex PFC neurogenesis assay (see Fig. 2a). (F) Scatter plot showing comparison of phenotypes between clone pairs in validation pool. Overall correlation r = 0.916, p < 0.0001. (G) Description of quality control to ensure that internal standard is suitable controls. Upper panel, cortical patterning of the UMOD is comparable to that of MEL1. MEL1 n = 3 differentiation, UMOD n = 1 differentiation. Lower panel, proliferation of the UMOD line was compared to the positive control line GSK3β, showing an expected lower proliferation rate than GSK3β across 5 mini-pools. As an example of the importance of quality control measures, the UMOD-B clone from the MIX32 pool, which showed off-target effect, would not have passed quality control as it did not show a lower proliferation rate than GSK3β. Minipool 1, n = 4; minipool 2, n = 4; minipool 3, n = 2; minipool 4, n = 1; minipool 5, n =1; UMOD-B, n = 4 differentiations. (H) Percent of SOX2 cells per differentiation, normalized to UMOD. 5/6 class 1 genes (blue) showed the expected increase in SOX2 percentage, while MEL1 was similar to UMOD. ANOVA p = 0.0025\. (I) DCX/SOX2 ratio for each line, normalized to UMOD. 6/6 class 1 genes (blue) showed the expected increase in DCX/SOX2 ratio, while MEL1 was similar to UMOD. ANOVA p < 0.0001. Graphs depict mean ± S.D., dots represent individual differentiations. Comparisons made using one-way ANOVA with post-hoc comparisons to UMOD, corrected using Dunnett test. Samples scaled to group mean. For all panels, UMOD, n = 7; MEL1, n = 5; GSK3β, n = 6; CTNNB1, n = 4; ANKRD11, n = 7; ASH1L, n = 7; ASXL3, n = 4; CUL3, n = 7; DEAF1, n = 7; RELN, n =7 differentiations. FACS, fluorescent activated cell sorting. See also Figure S4.