
Figure 6. Class-specific dysregulation of neural crest development.
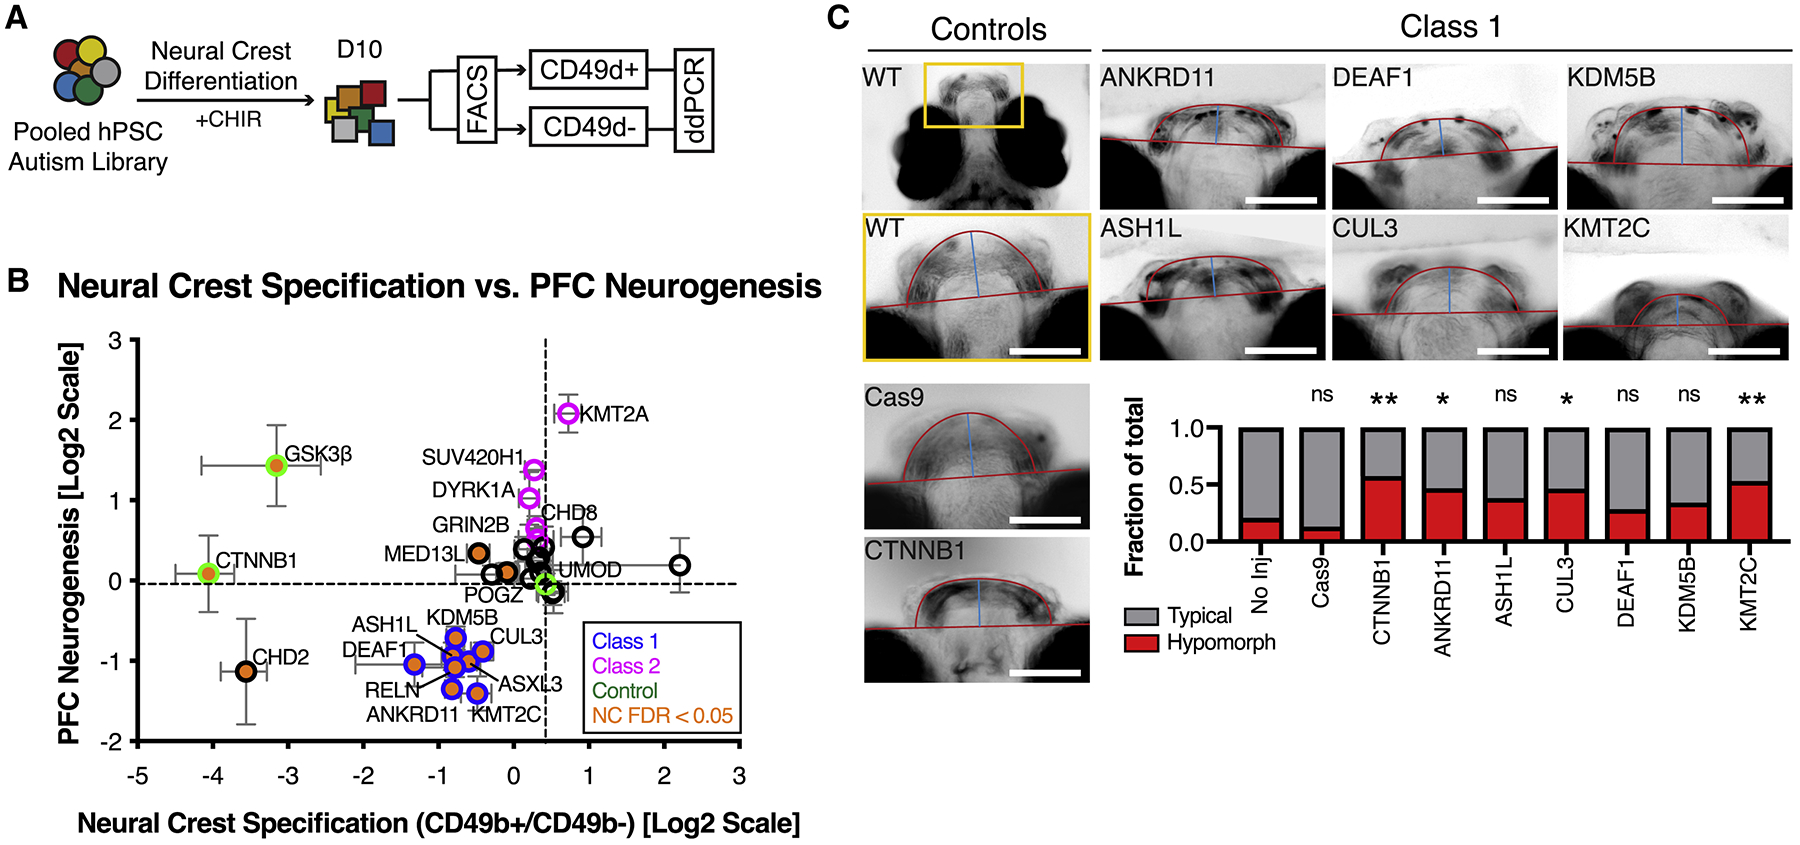
(A) Schematic illustration of multiplex strategy to test autism mutations for WNT/βcatenin response during neural crest development. MIX30 hPSC pools are differentiated toward neural crest for 10 days using an established WNT-dependent protocol. Allele frequencies are then compared between cranial neural crest positive (CD49d+) and negative (CD49d-) sorted fractions. (B) Correlation of neural crest specification with PFC neurogenesis phenotypes reveals that 8/8 Class 1 mutations (blue edge) impair cranial neural crest specification (orange, FDR < 0.05). All error bars are mean ± S.E.M. FDR calculated using Welch ANOVA with post-hoc comparisons to UMOD, p-values corrected for multiple comparisons using Benjamini, Krieger, Yekutieli method. Internal standards are colored green. (C) Analysis of zebrafish jaw development in F0 mosaic loss-of-function animals imaged ventrally at 7 dpf. Top left image depicts area of high magnification. Cas9 alone and CTNNB1 gRNA injections serve as controls. Class 1 mutations exhibit hypomorphic jaw phenotypes that resemble those of CTNNB1 mutants (CTNNB1 p = 0.0064, ANKRD11 p = 0.0488, CUL3 = 0.0488, KMT2C = 0.0088). p values calculated using Fisher’s exact test corrected for multiple comparisons using Benjamini-Hochberg method. No injection n = 43, Cas9 alone n = 23, CTNNB1 n = 40, ANKRD11 n = 32, ASH1L n = 68, CUL3 n = 43, DEAF1 n = 28, KDM5B n = 41, KMT2C n = 47 fish. All injections performed on at least 2 clutches. Dpf, days post fertilization. Scale bars, 100μm. See also Figure S6 and Table S3.