
Figure 1.
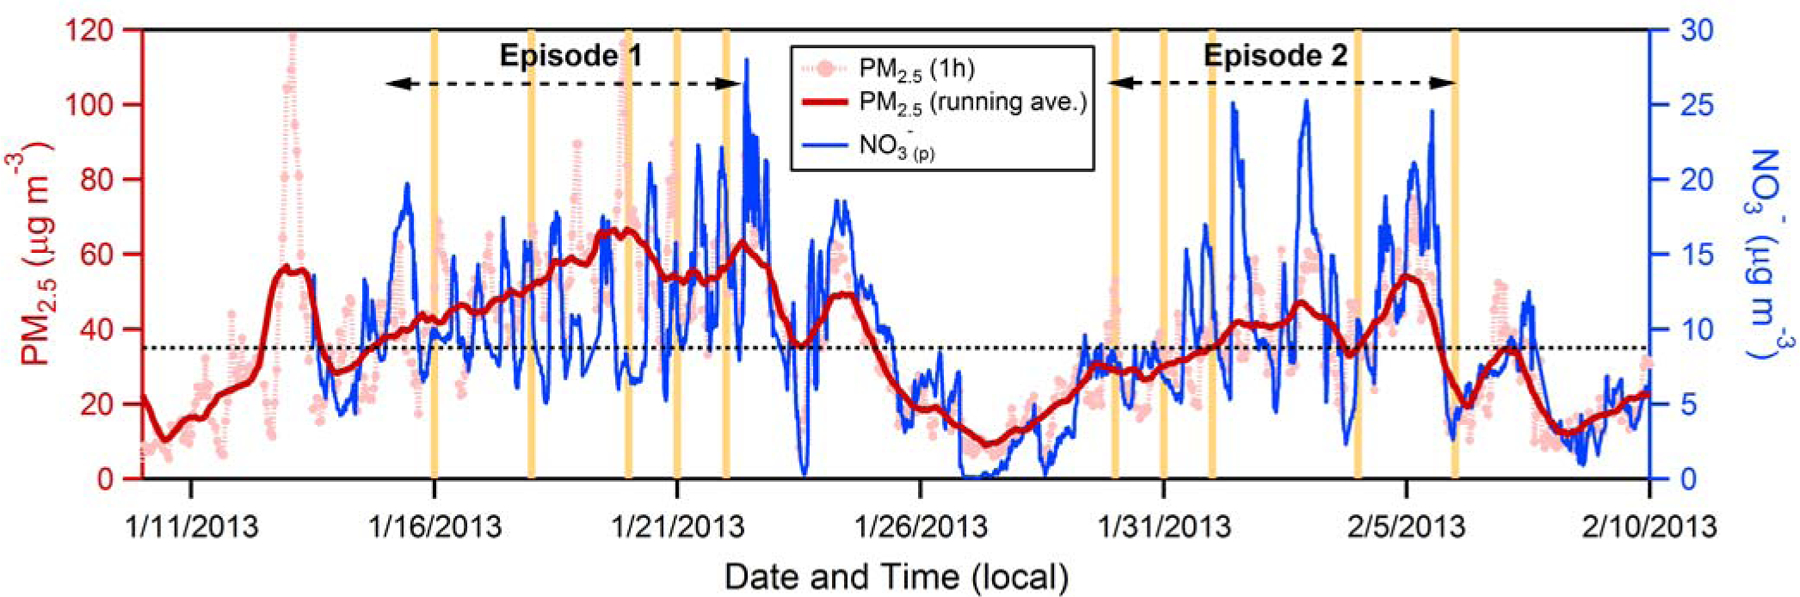
Time series of surface PM2.5 concentration (μg m-3) measured in Fresno during the DISCOVER-AQ campaign for 1 h averages (light red dotted line) and for a running average (red line; smoothed over 24 h), along with the 1 h average NO3-(p) concentration (blue line). The vertical orange lines indicate the days on which airborne measurements were made. The horizontal dashed black line indicates the NAAQS 24 h standard of 35 μg m-3 for PM2.5.