Figure B3.

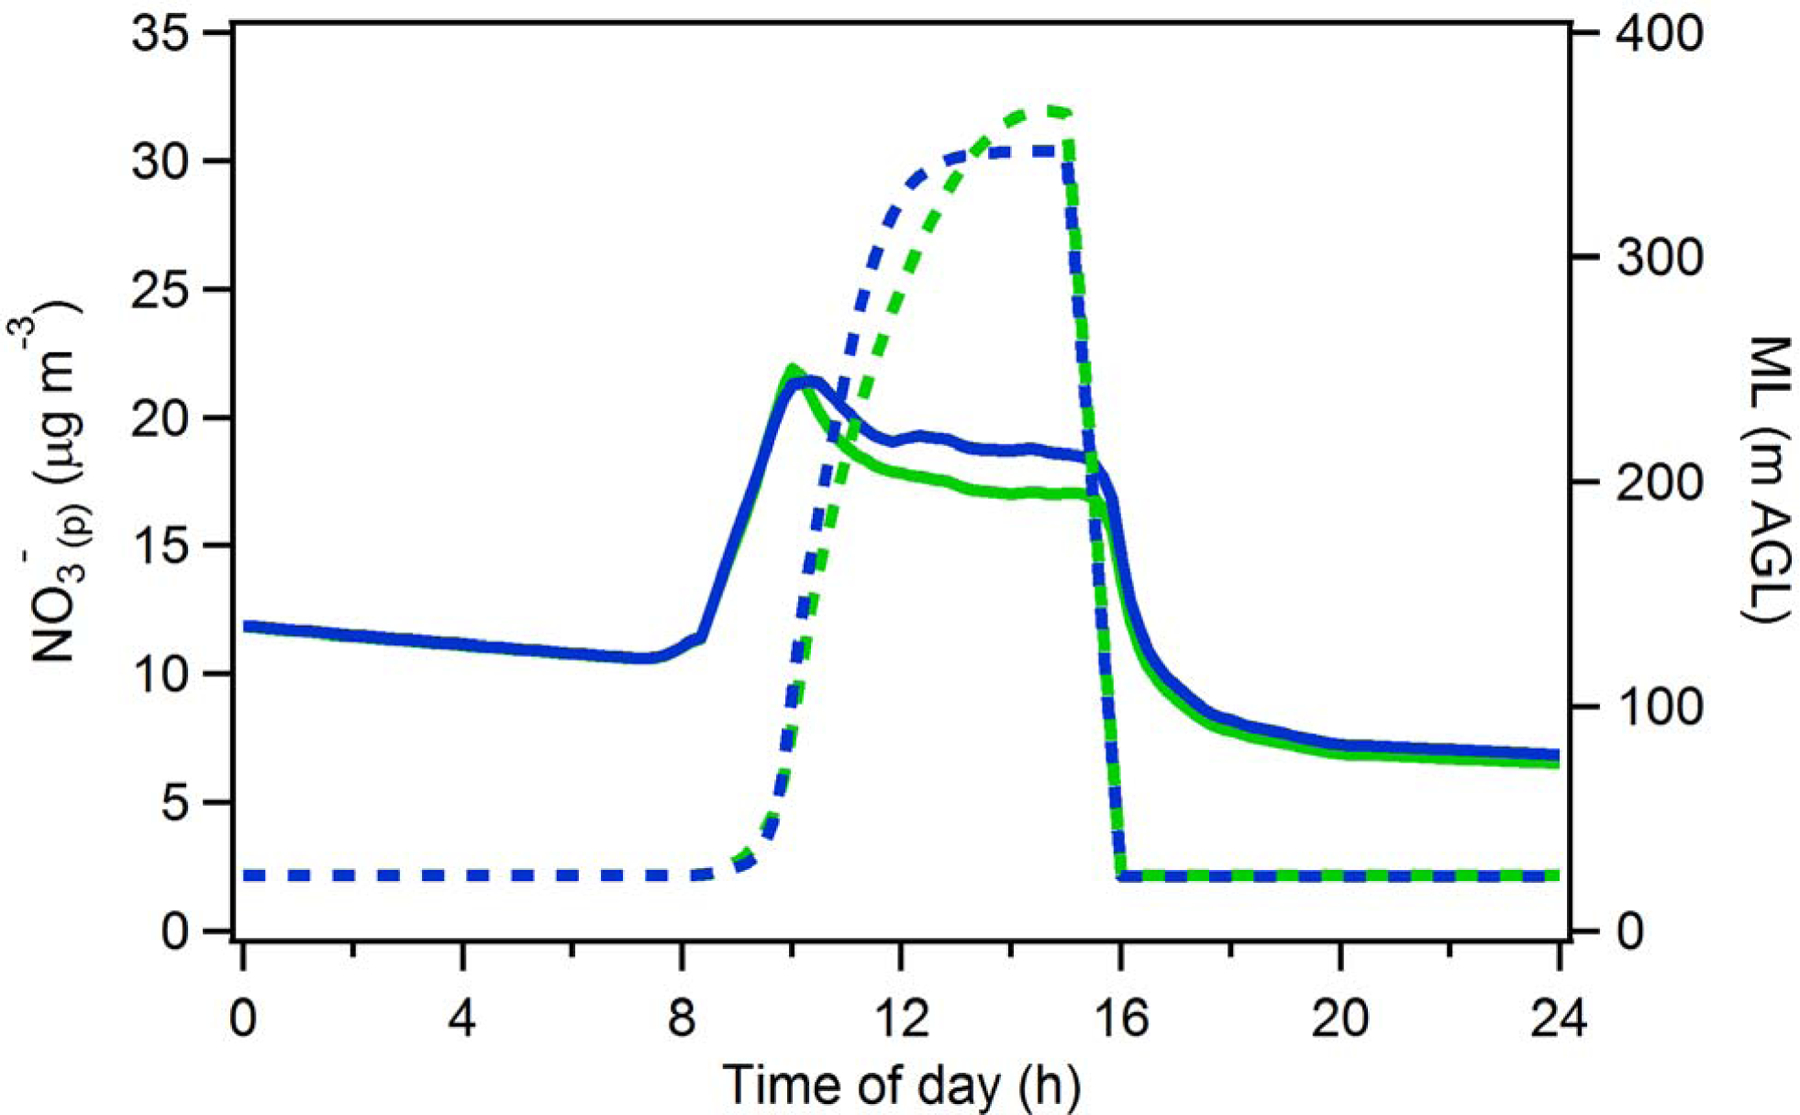
Average modelled surface NO3-(p) (solid lines) using the CLASS model output (green) and a sigmoid fit to the observed ML heights (blue). The ML heights used in the model are shown in dashed lines.

Average modelled surface NO3-(p) (solid lines) using the CLASS model output (green) and a sigmoid fit to the observed ML heights (blue). The ML heights used in the model are shown in dashed lines.