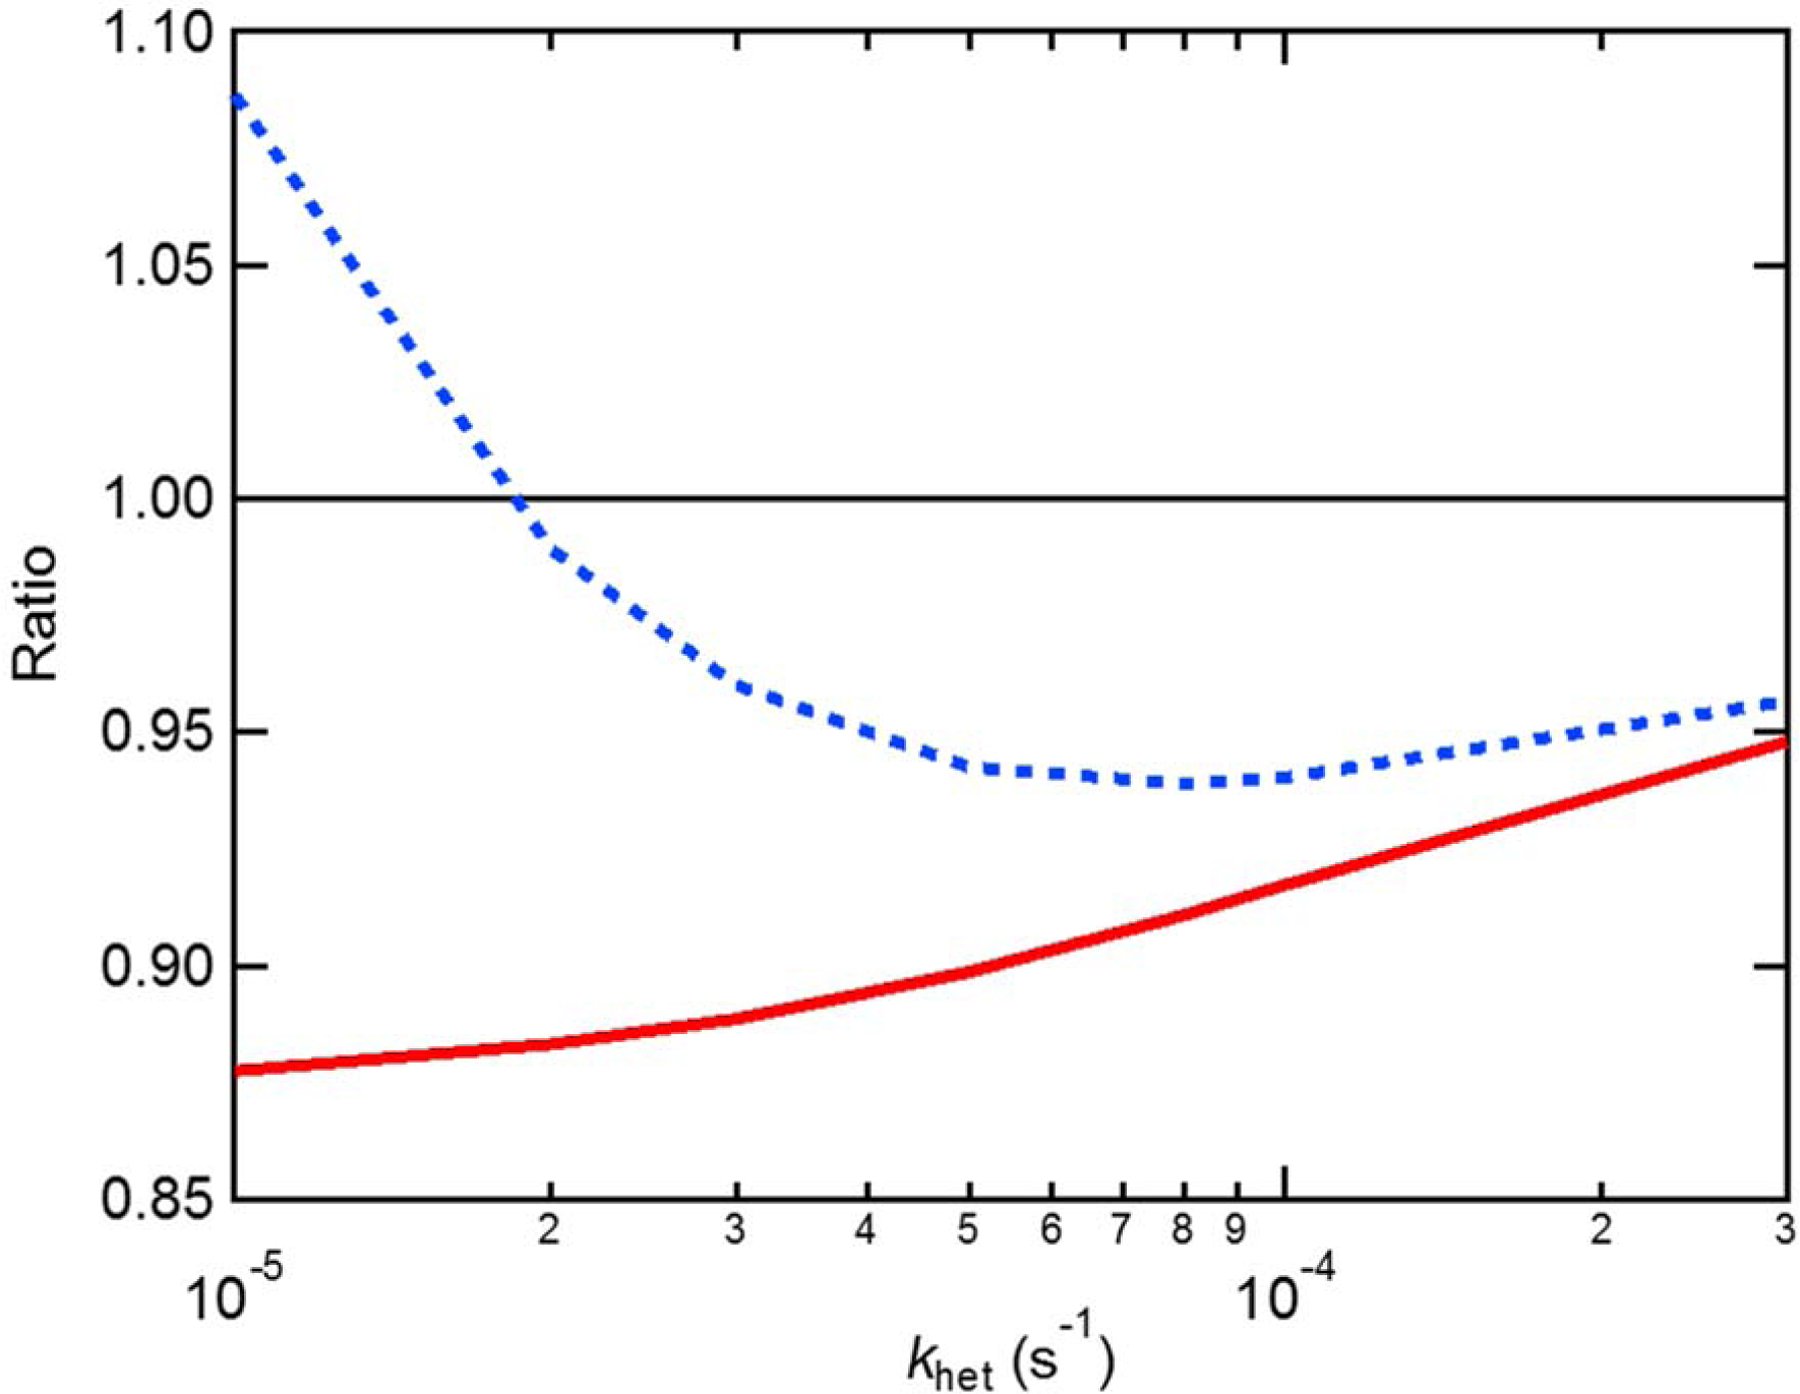
Figure C1.

Model results showing the influence of including NO3 + VOC reactions on HNO3 production via the heterogeneous hydrolysis of N2O5, as a function of the heterogeneous oxidation rate. The red line shows the ratio between the HNO3 produced via N2O5 hydrolysis when reactions with VOCs are considered and when they are not. Reaction of NO3 with VOCs reduces the HNO3 formed via hydrolysis. The blue line shows the ratio between the total HNO3 produced from either N2O5 hydrolysis or NO3 + VOC reactions when reactions with VOCs are considered and when they are not.
