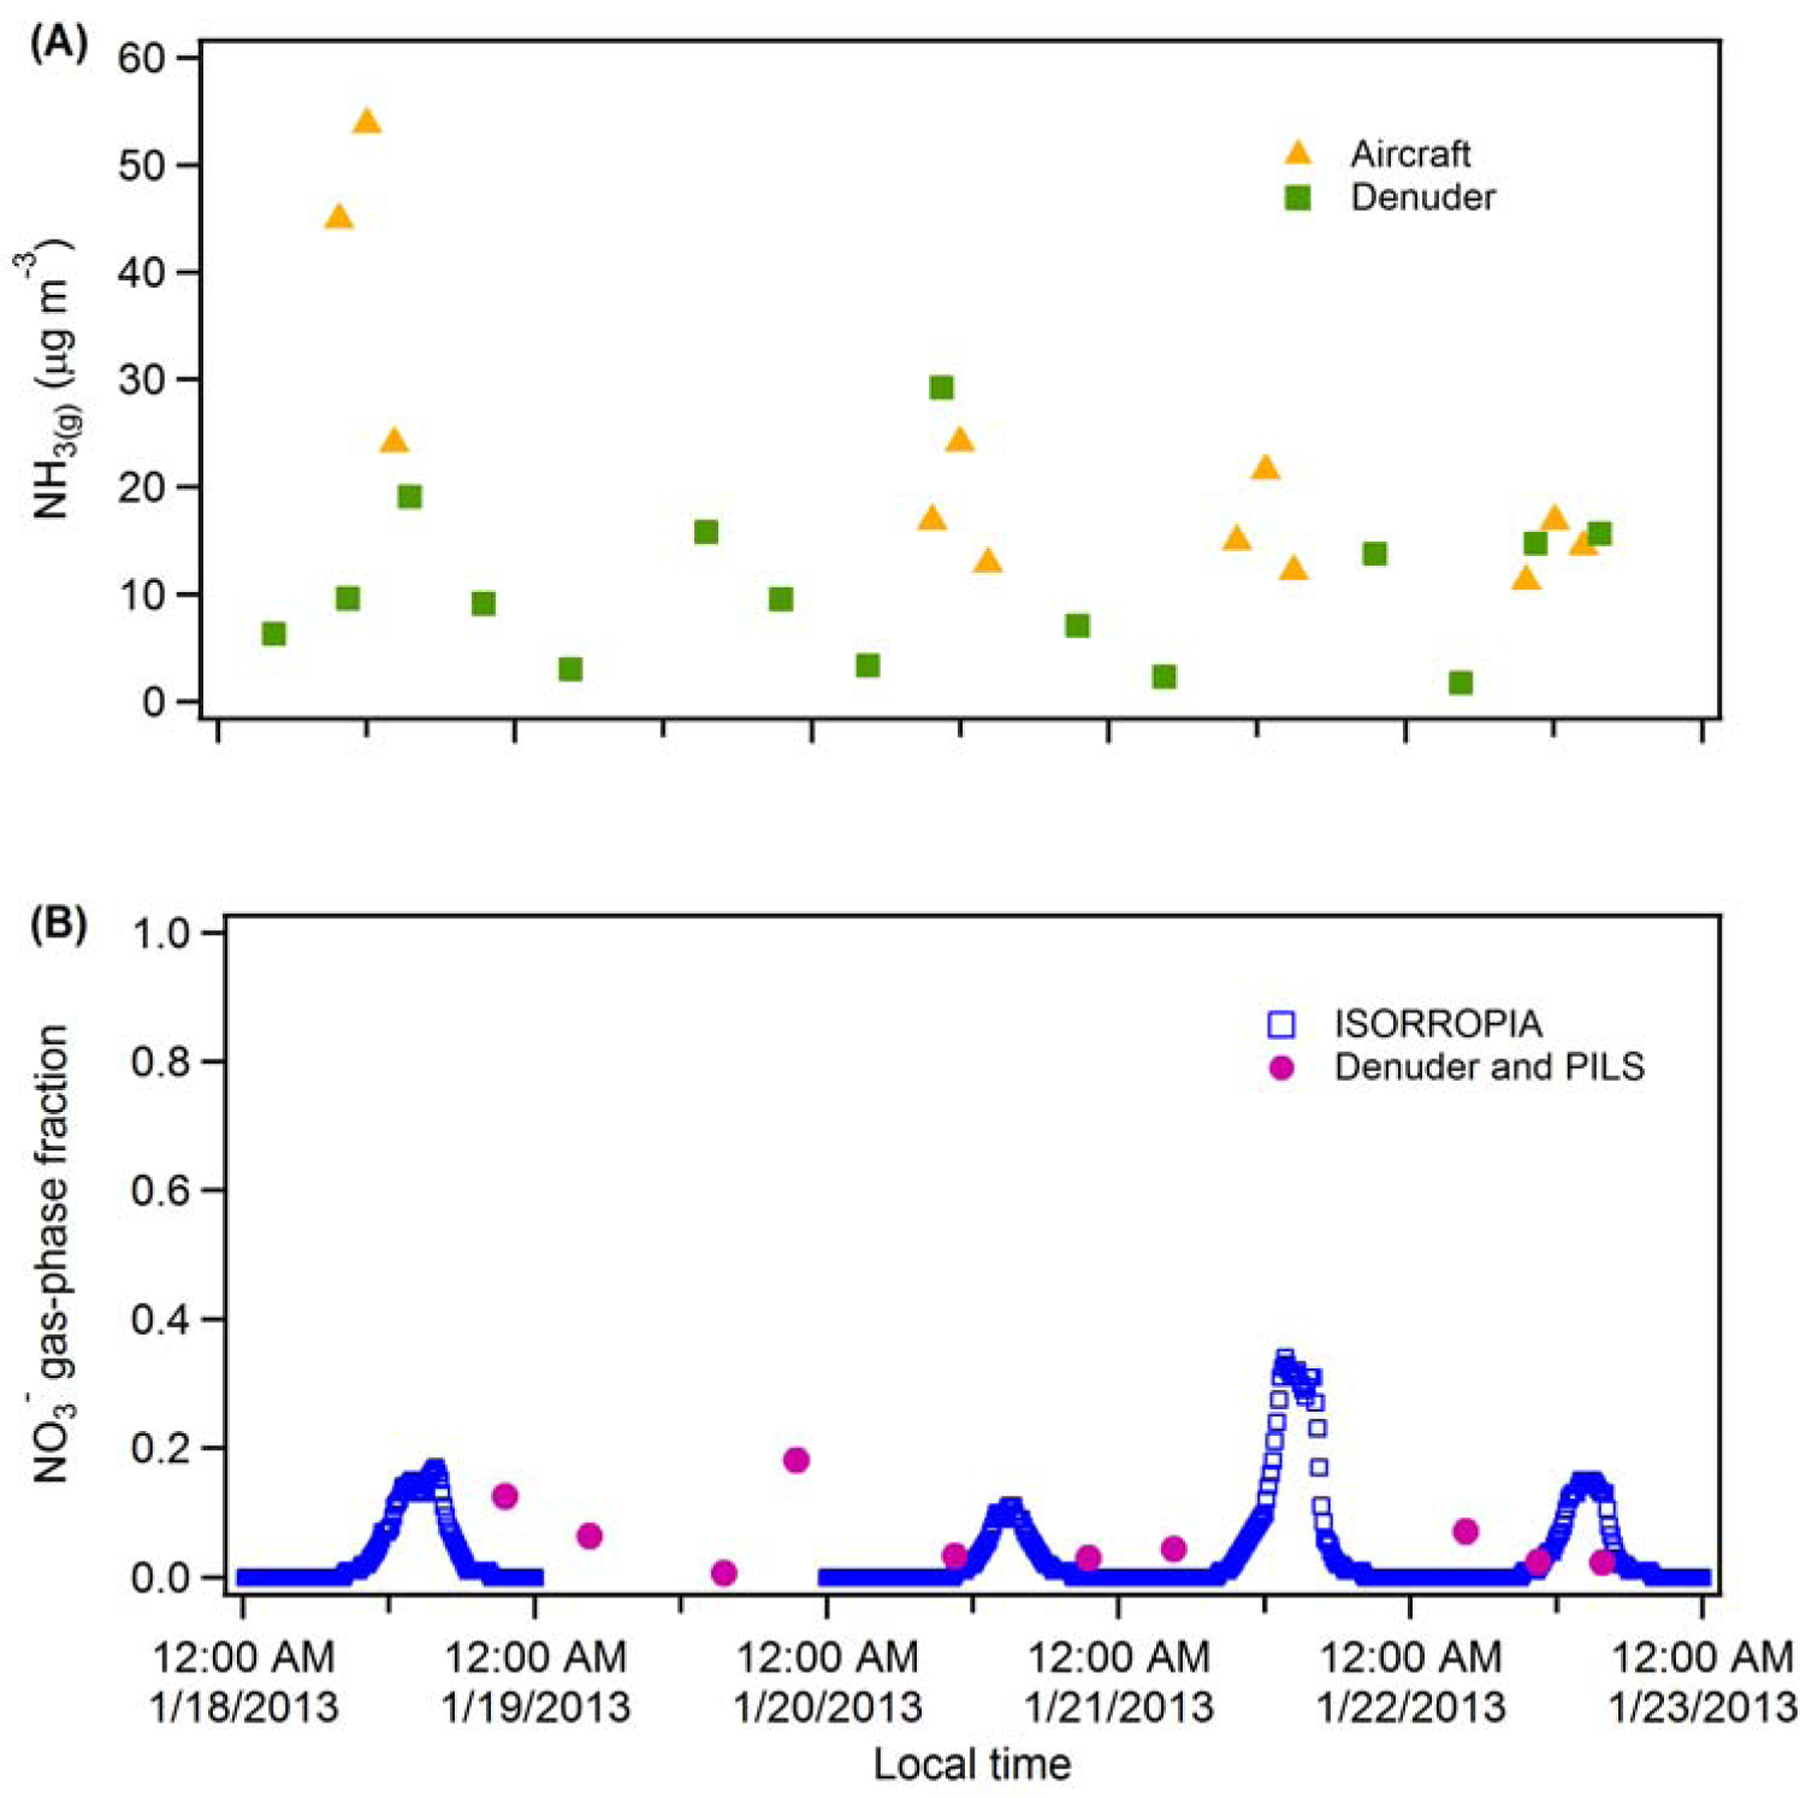
Figure D1.

(A) Time series of NH3(g) (μg m-3) measured with the denuder at the surface (green squares) and at the lowest altitudes by CIMS onboard P3-B aircraft (yellow triangles). (B) The nitrate gas-phase fraction estimated by ISORROPIA (blue squares) and the observed fraction determined from the denuder HNO3(g) and PILS NO3-(p) measurements (pink circles) (Parworth et al., 2017).
