
Figure 2.
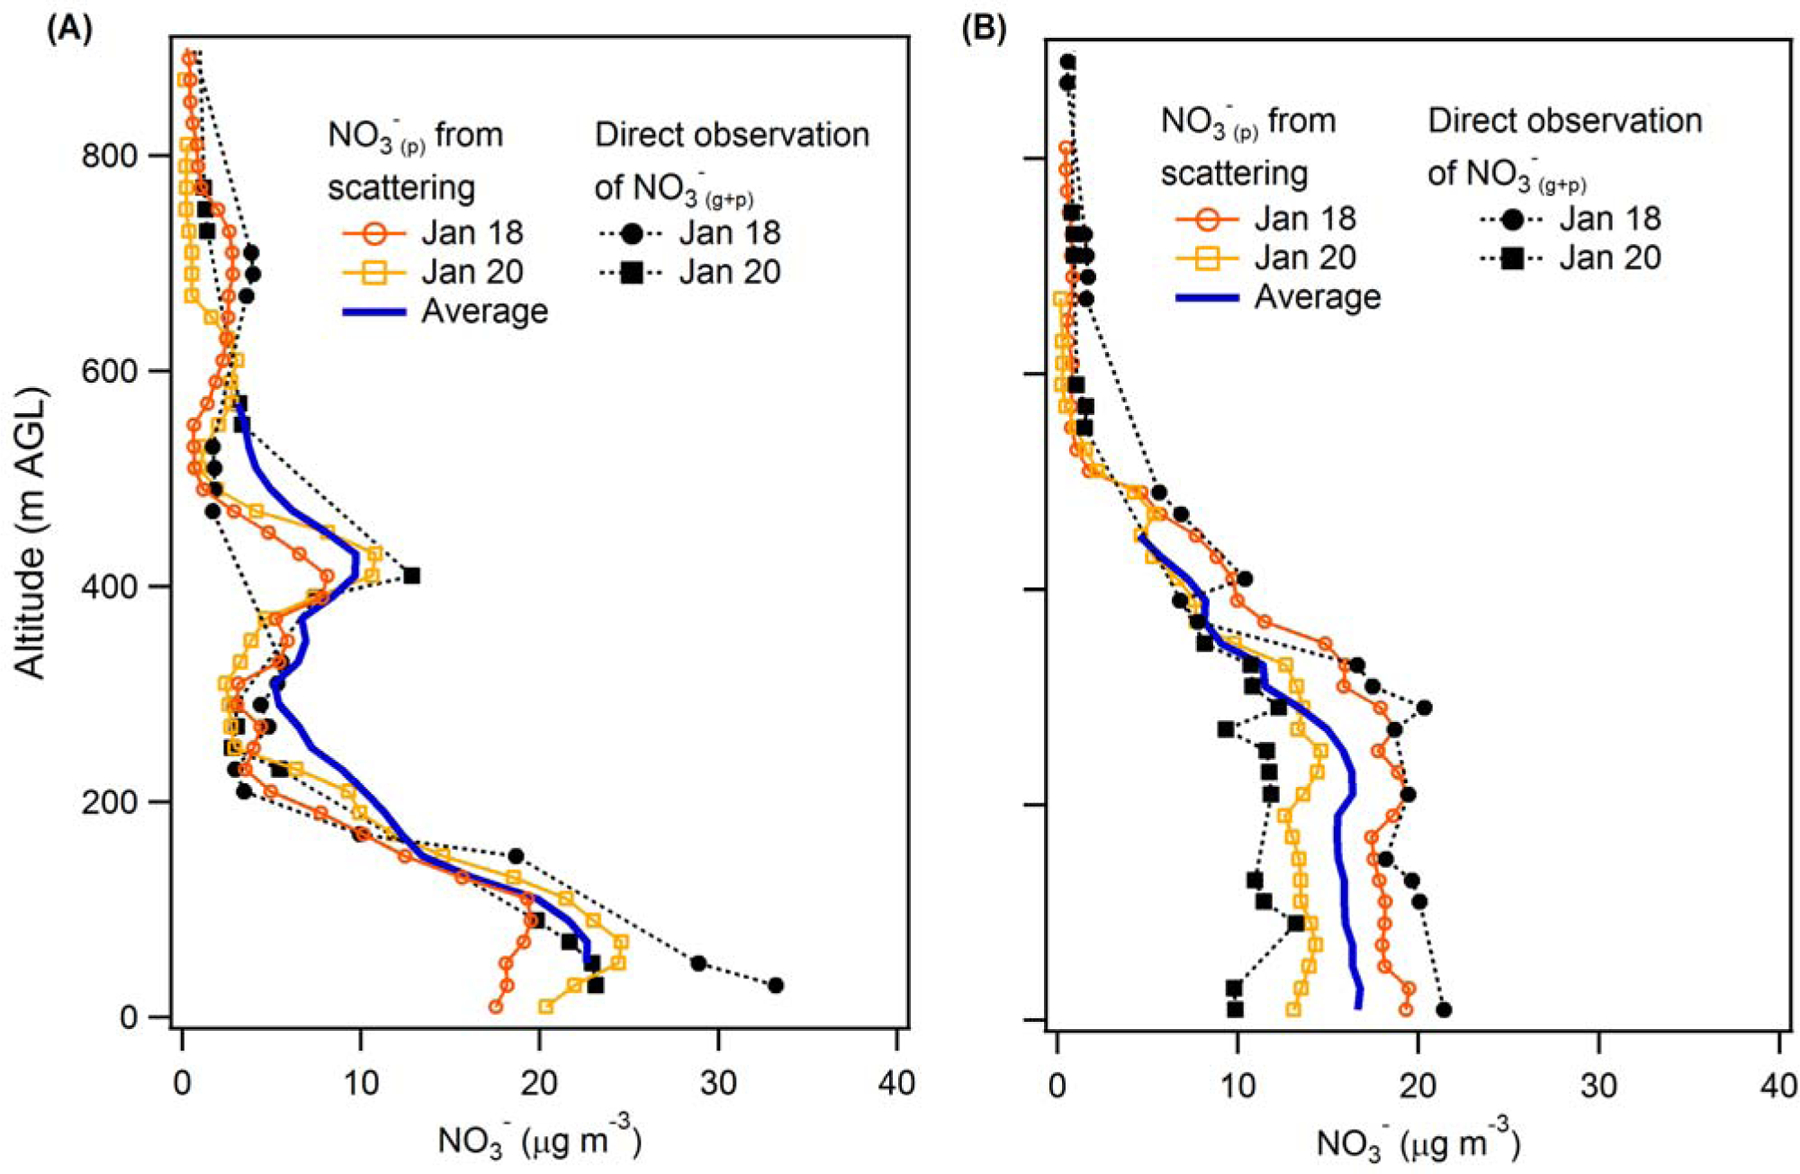
Vertical profiles for two individual flight days of particulate nitrate concentrations estimated from in situ total particle scattering measurements (open markers) and total nitrate (gas + particle) concentrations measured by the TD-LIF (solid black markers) for (A) the morning (~9:30 am) and (B) the afternoon ~2:30 pm. The solid blue lines indicate the average NO3-(p) vertical profiles for all four flight days of Episode 1 (Jan 18, 20, 21 and 22).