
Figure 4.
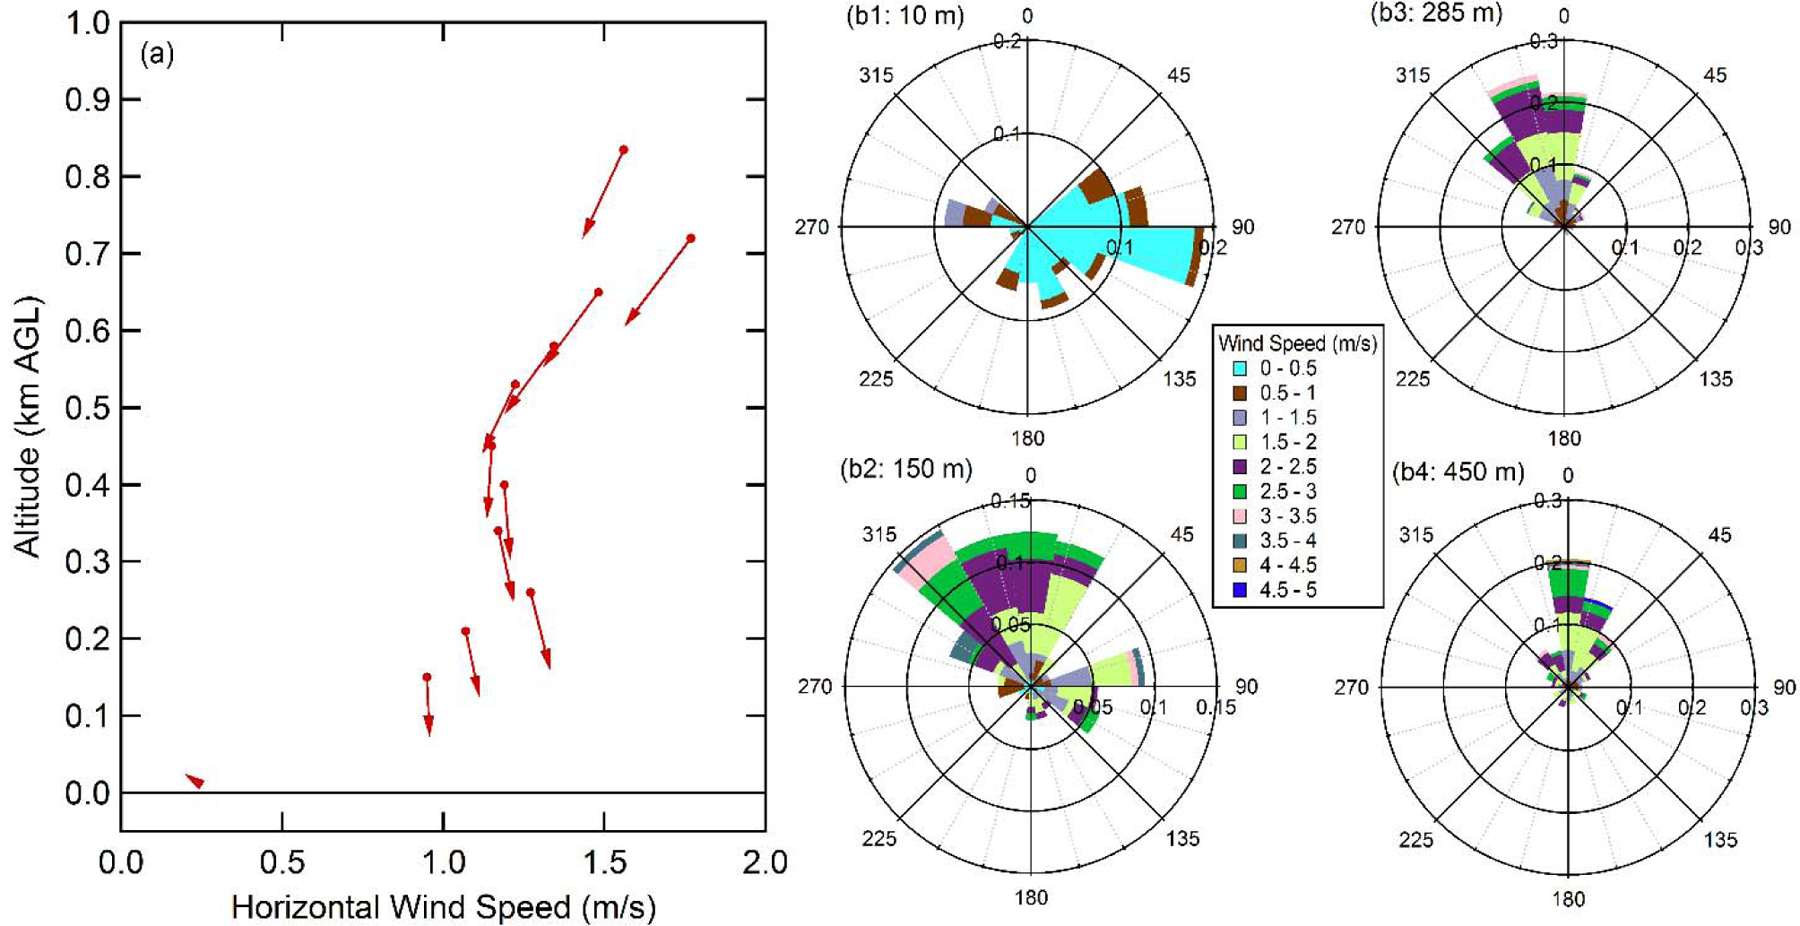
(a) Vertical profile of the average night time (19:00–07:00) horizontal winds over Visalia, CA (65 km SE of Fresno) and the surface (10 m) wind in Fresno for flight days during Episode 1 (Jan. 18, 20, 21, and 22). The length of the arrows corresponds to the wind speed and the direction to the average wind direction, with the measurement height indicated by the small circle on the tail of the arrow. (b) Corresponding wind roses for (b1) the surface, (b2) 125–175 m, (b3) 225–345 m, and (b4) 400–500 m. The length of each arc corresponds to the normalized probability and the colors indicate the wind speed (m/s; see legend). Data are from the National Oceanic and Atmospheric Administration, Earth System Research Laboratory, Physical Sciences Division Data and Image Archive (https://www.esrl.noaa.gov/psd/data/obs/datadisplay/, accessed 3 June 2017).