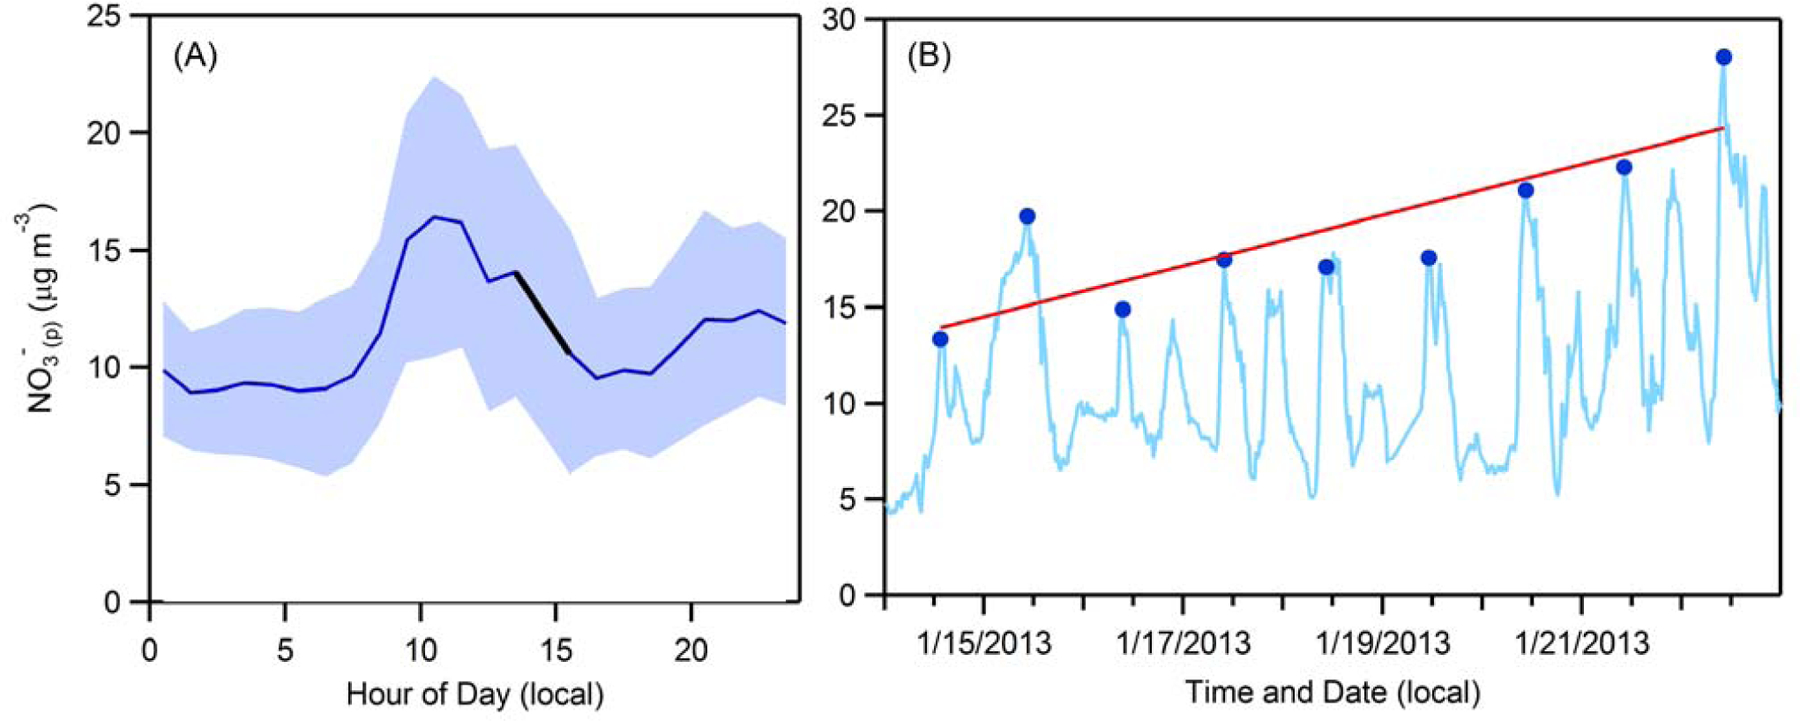
Figure 6.

(A) Average diurnal profile (solid line) of surface NO3-(p) for all days of Episode 1. The shaded area indicates the 1σ standard deviation. The solid black line is a linear fit (r2 = 0.99) to the data between 1:30 pm and 3:30 pm. (B) Time series (solid blue line) of surface-level NO3-(p) during Episode 1. The circles indicate the daytime peak values. The linear fit (red line) to the daytime NO3-(p) peaks suggest an increase of 1.32 μg m-3 day-1.
