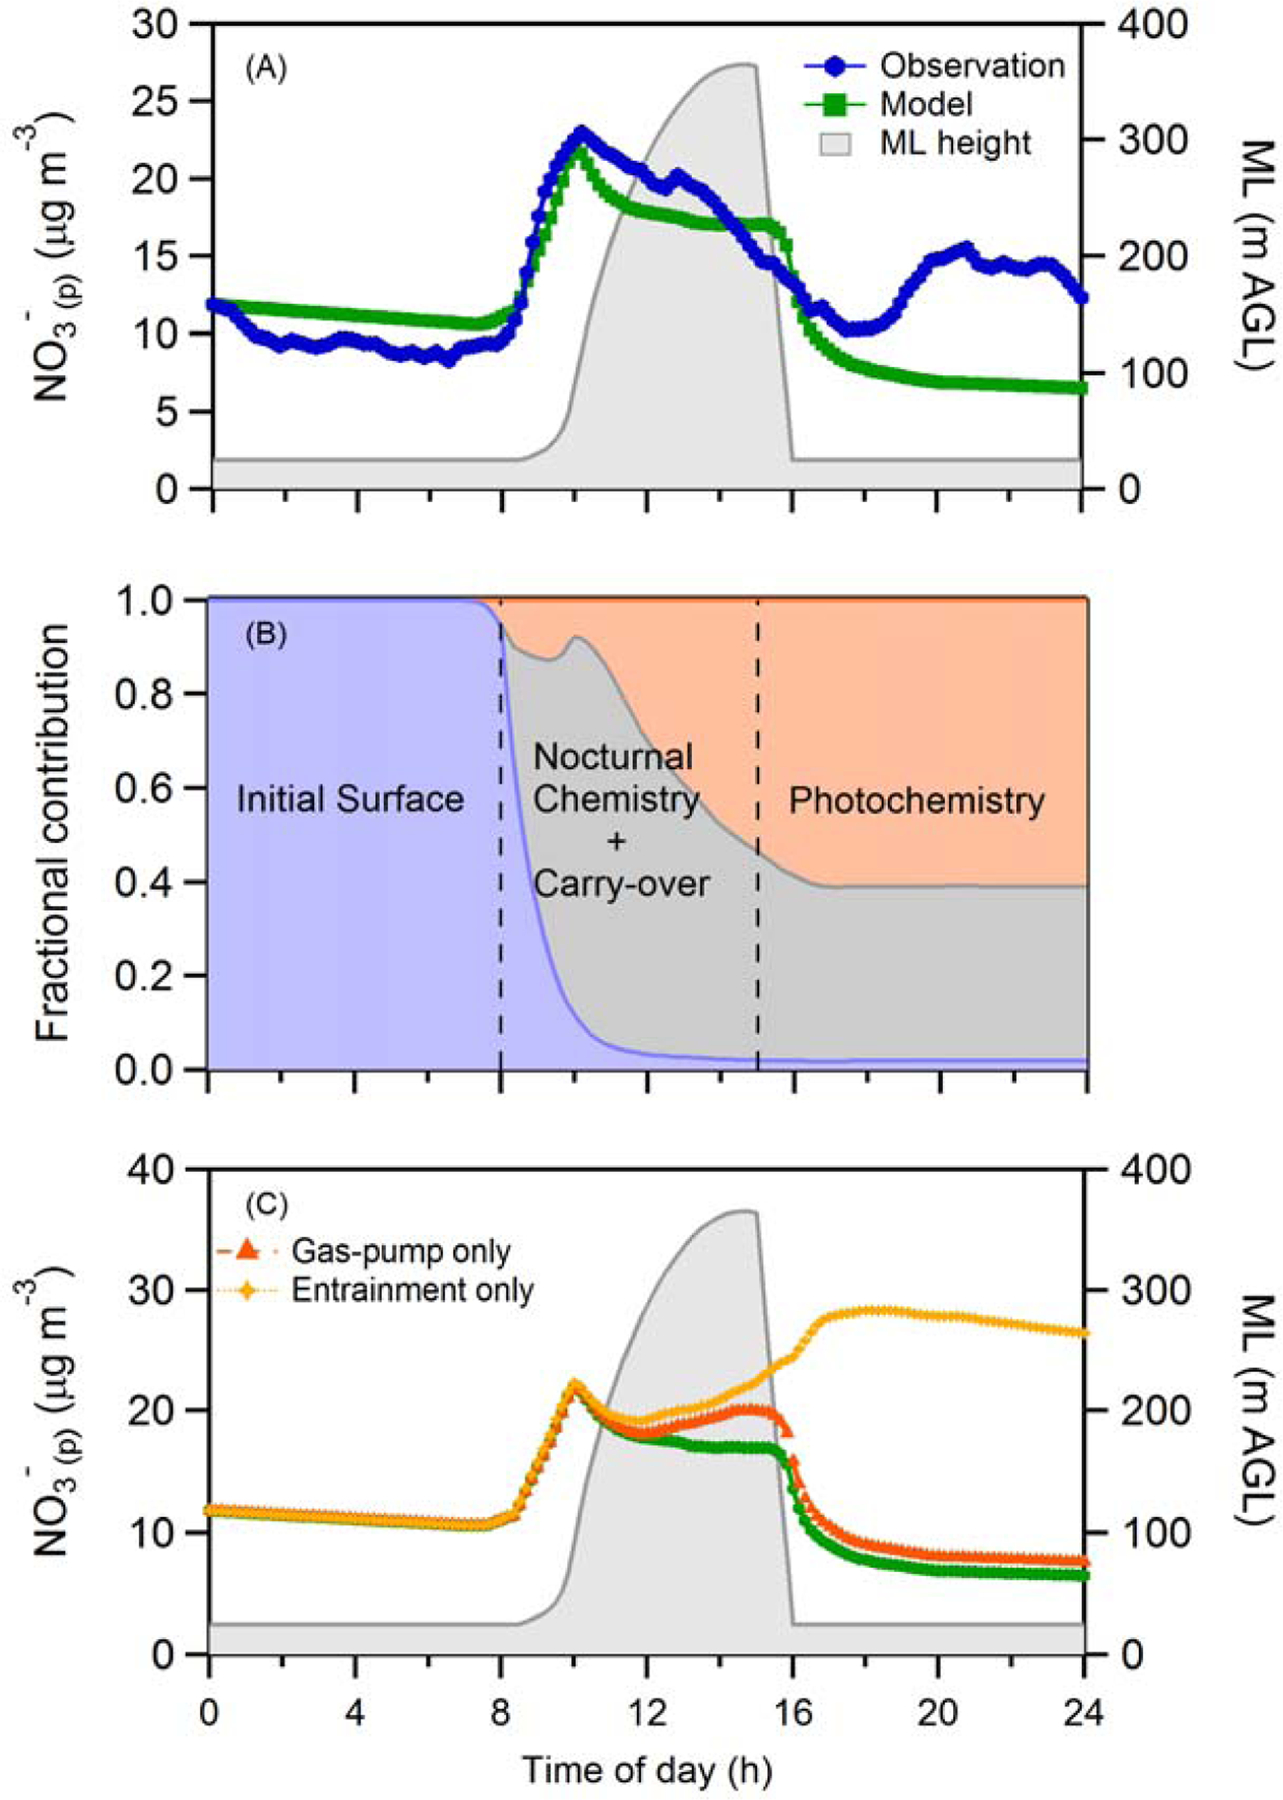
Figure 7.

(A) Comparison between the observed (blue circles) and observationally constrained model predicted (green squares) diurnal profile of the surface NO3-(p) concentration (μg m-3) for the four flight days (18th, 20th, 21st and 22nd January, 2013) during Episode 1. Also shown is the diurnal variation in the boundary layer height (gray), as constrained by daytime measurements. (B) The diurnal variation in the simulated fraction of the total surface-level NO3-(p) contributed by the initial surface-level NO3-(p) (i.e. that at surface-level at 12:00 am), the NO3-(p) mixed down from the RL, and NO3-(p) produced from daytime photochemical reactions. (C) Comparison between the simulated diurnal profile when all processes are included (green squares, same as Panel A) and when only one NO3-(p) sink at a time is considered. The individual sinks considered are only entrainment of free troposphere air (yellow crosses) or only dry deposition of HNO3 via the gas-phase pump (orange triangles).
