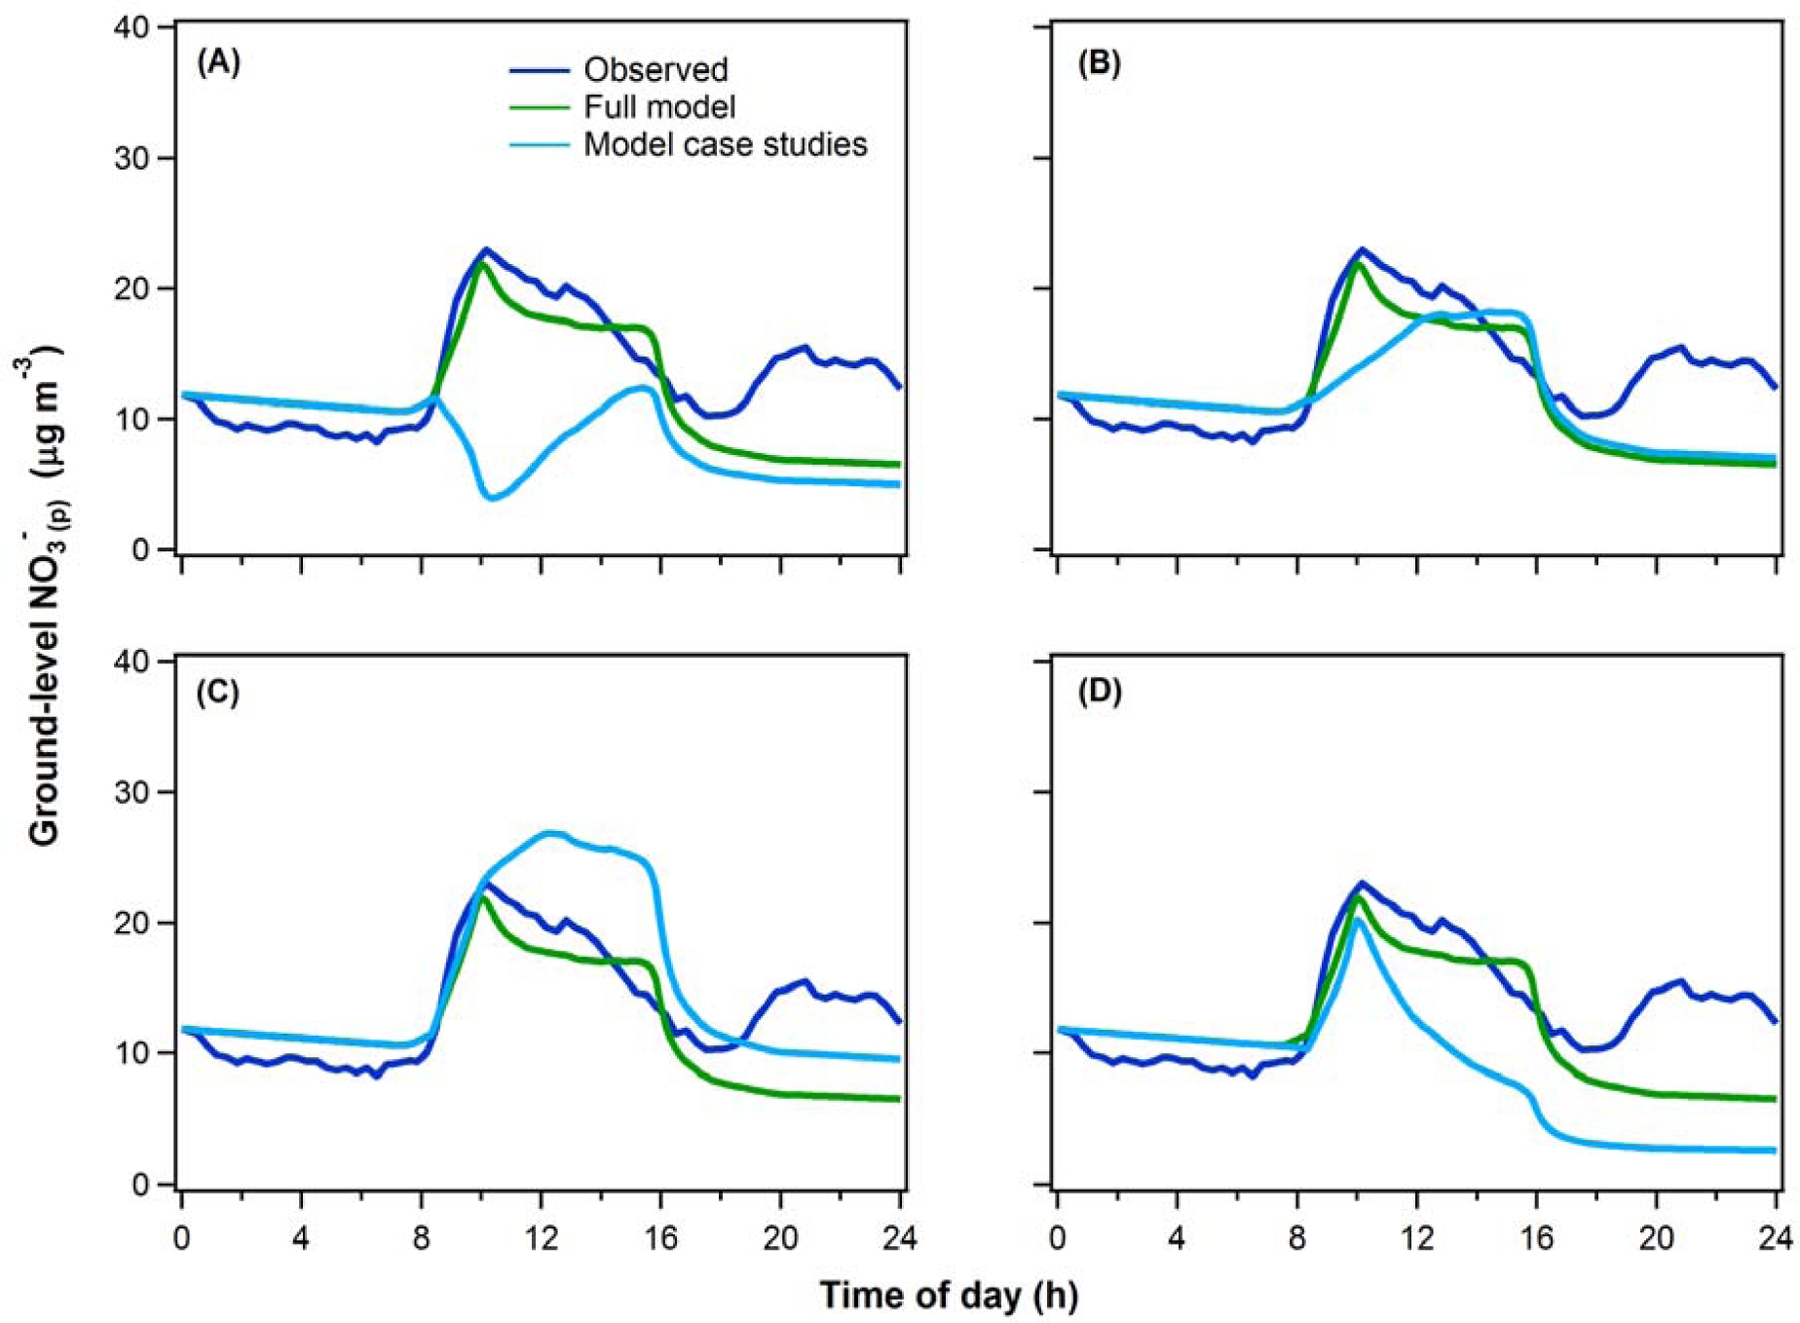
Figure 8.

Model predictions of the diurnal variation in surface-level NO3-(p) under (A-C) different assumptions regarding the NO3-(p) concentration and vertical variability in the early-morning RL, or (D) without daytime photochemical production of NO3-(p). In all panels the blue curve shows the observations and the green curve shows the full observationally constrained model results (identical to Figure 6) for the average of the four flight days in Episode 1. For (A-C), the assumptions were: (A) The [NO3-(p)]RL is equal to zero; (B) The [NO3-(p)]RL is constant with altitude and equal to the NO3-(g+p) at 3 pm previous afternoon, corresponding to a case of zero net production or loss; (C) the [NO3-(p)]RL is constant with altitude and equal to the maximum observed [NO3-(p)] in the early-morning RL profile.
