
Figure 9.
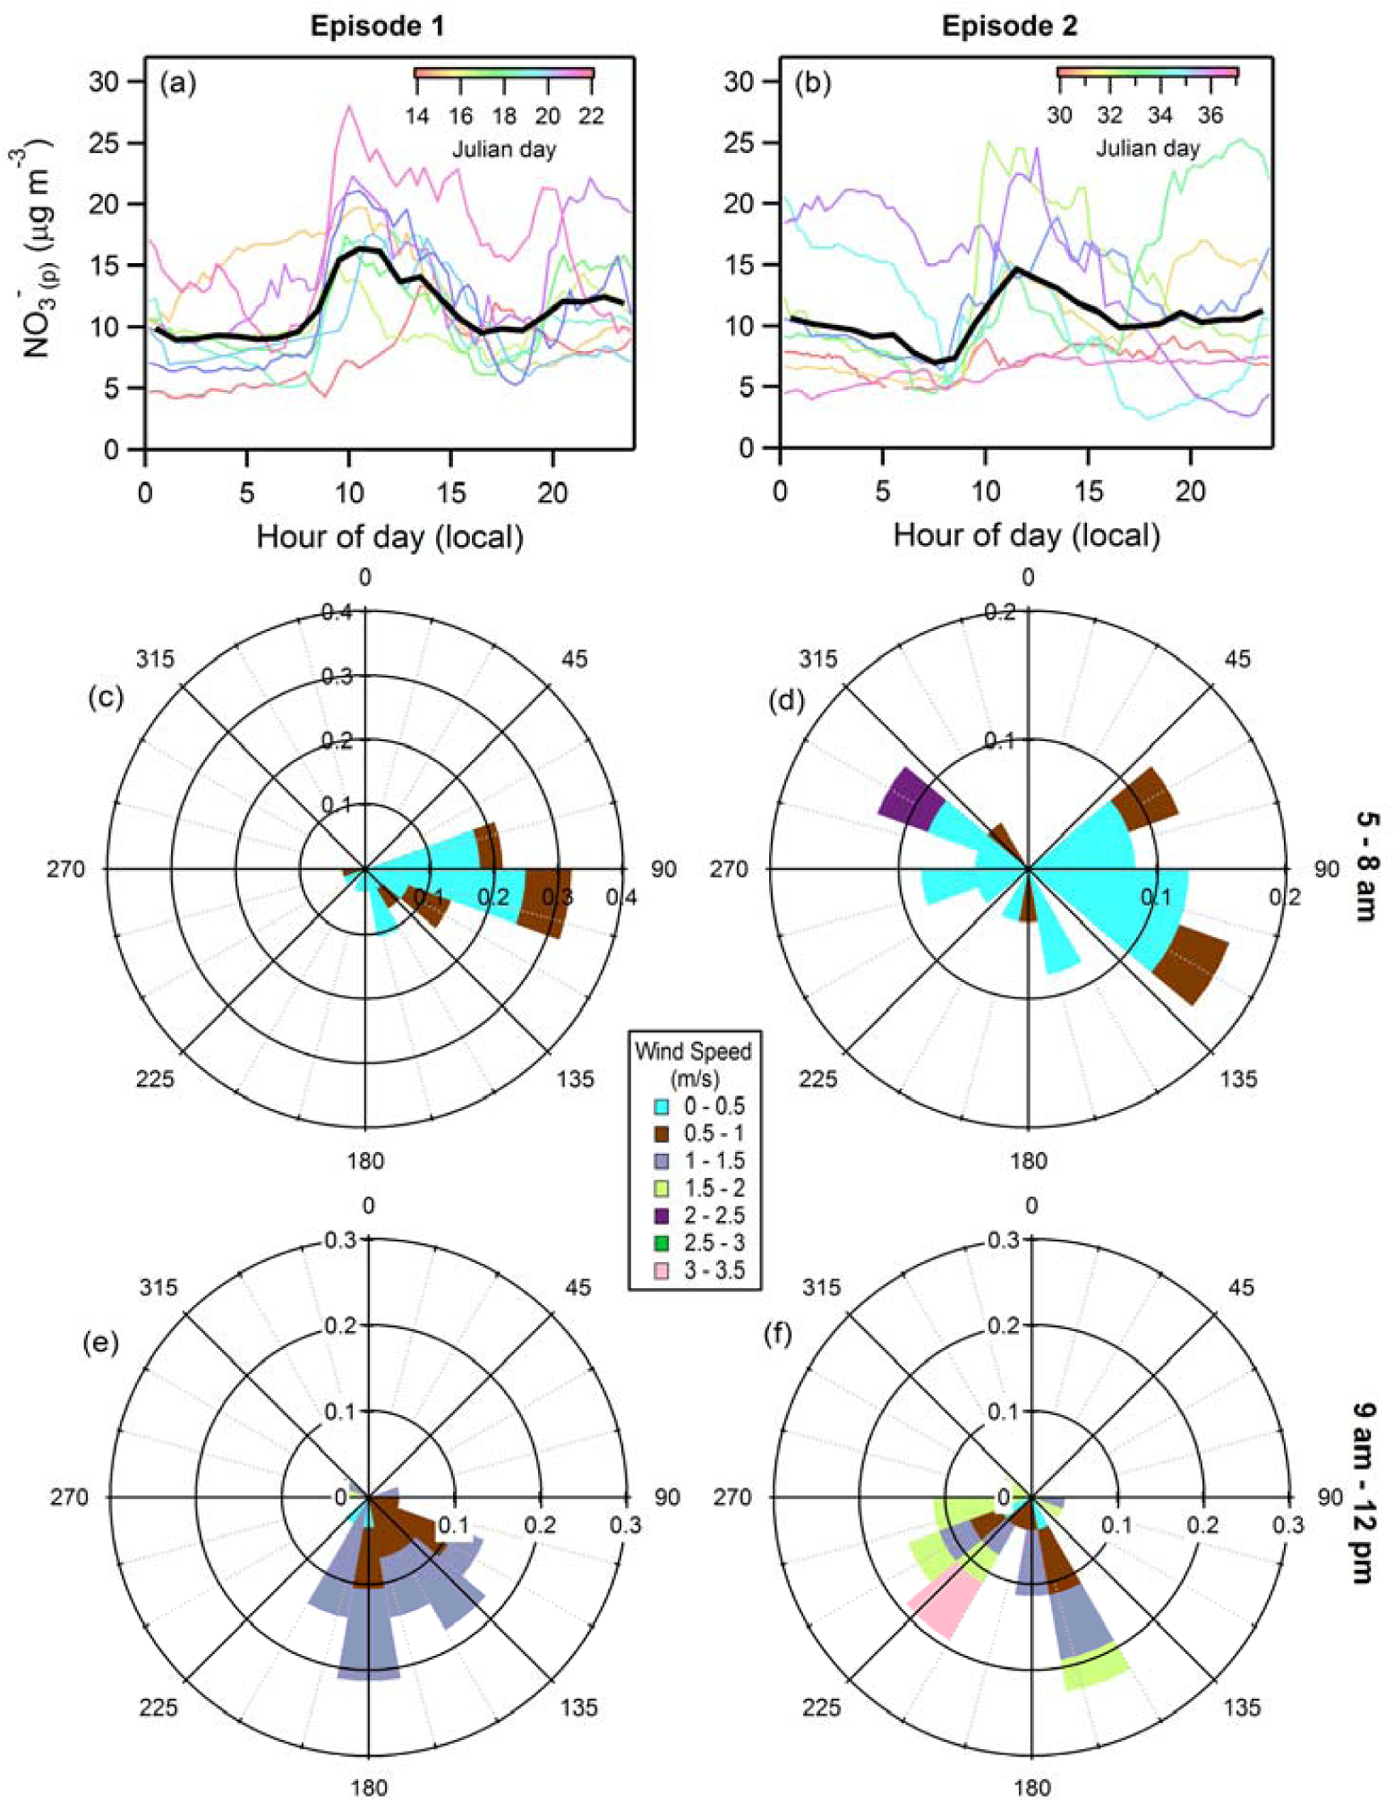
(Top panels) Diurnal variation in the surface-level particulate nitrate concentration during (a) the first episode and (b) the second episode. The solid black lines are the average profile over the episode and the colored lines are for individual days. (Middle/Bottom panels) Wind roses for surface-level (10 m) winds in Fresno for the early morning (5 – 8 am) during (c) episode 1 and (d) episode 2, and for the late morning (9 am – 12 pm) during (e) episode 1 and (f) episode 2.