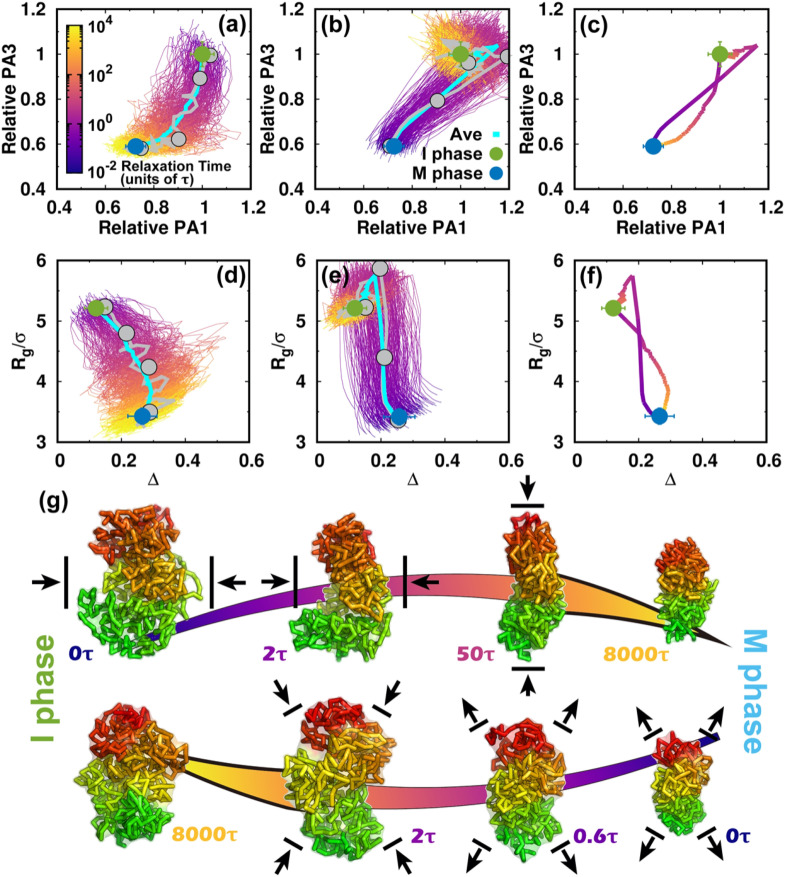
FIG. 3.
Shape changes of the chromosome during the cell cycle. (a) The pathways projected onto the first and third principal axes (PAs) during the transition from the I to the M phase. The first and third PAs are defined to be the longest and shortest in the chromosome conformation, respectively. The PA lengths are relative to the mean values of those at the I phase. Thus, the transition approximately starts from (1, 1) and decreases during the condensation process to the M phase. All the transition trajectories are shown and colored by time in a logarithmic scale. The green and blue dots represent the mean values for the I and M phases. The error bars correspond to the standard deviations. The pathway averaged by all trajectories is shown with the cyan line. (b) Like (a) but for the transition from the M to the I phase. (c) The average pathways colored using a logarithmic timescale for the two directional transitions. (d) The pathways projected onto the aspherical parameter Δ and radius of gyration Rg during the transition from the I to the M phase. Δ is in the range 0–1. For perfect spheres, Δ = 0. (e) Like (d) but for the transition from the M to the I phase. (f) The average pathways for the two directional transitions. (g) Typical chromosome structures extracted from the transition trajectories. Upper: I → M transition. Lower: M → I transition. The pathways for the selected structures are shown in (a), (b), (d), and (e) by gray lines with dots corresponding to the positions of the structures. The chromosome structures are colored from red to green based on the genomic distance. The black arrows for the chromosome structures illustrate the major shape changes expected in the next step.

