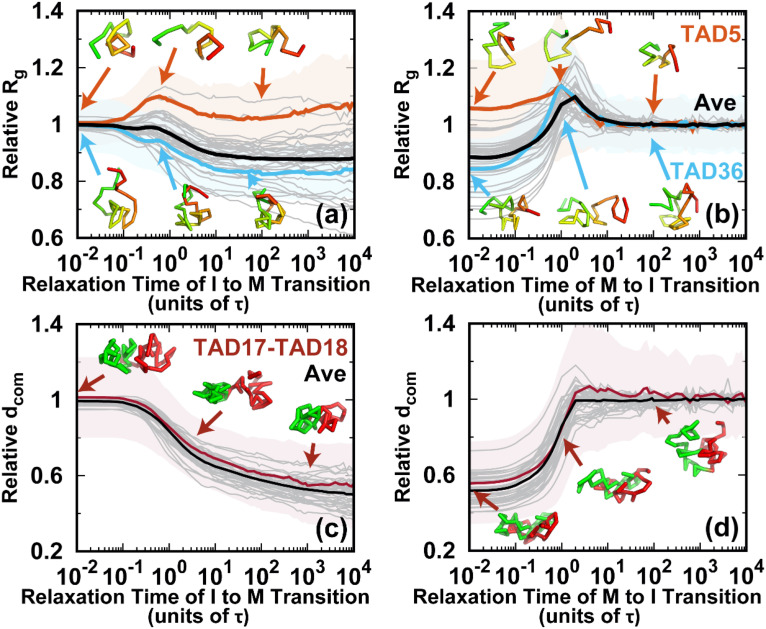
FIG. 5.
Conformational dynamics of the TADs during the cell cycle. The pathways for the radius of gyration Rg of the TADs for the (a) I → M and (b) M → I transitions. Rg relative to the mean value in the I phase for all 40 TADs is shown as gray lines. TAD5 (fifth TAD, orange, the same notation used thereafter) and TAD36 (blue) are selected for illustration. The shaded regions are the corresponding variances. Representative structures of the selected TADs are shown and colored from red to green based on genomic distance. The pathways for the distance of the center of mass () between neighboring TADs for the (c) I → M and (d) M → I transitions. relative to the mean value in the I phase for all 40 TADs is shown as gray lines. The distance between TAD17 and TAD18 (TAD17–TAD18) is selected for illustration. The shaded regions are the variances. The representative structures TAD17 and TAD18 are colored red and green, respectively.

