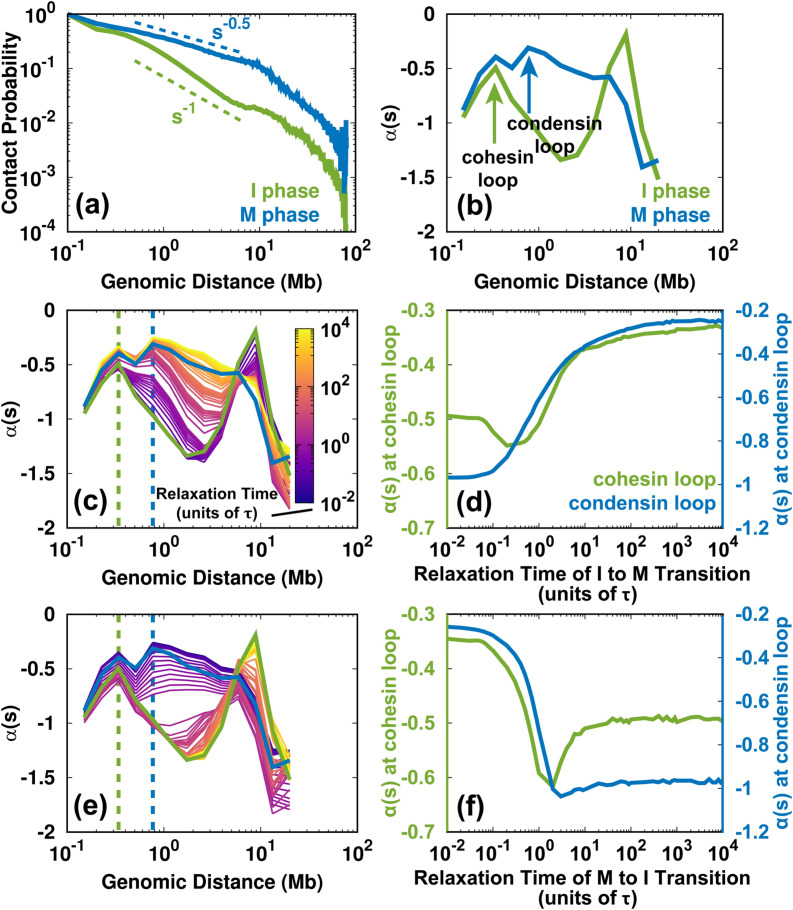
FIG. 8.
Changes to the SMC complex-mediated loops during the cell cycle. (a) Logarithmic plot of the contact probability Ps vs genomic distance s for the Hi-C data for the I and M phases. Ps has distinct decaying patterns in the I () and M () phases within 10 Mb. (b) The slope of has local maxima in the I and M phases, corresponding to the sizes of the cohesion and condensin loops, respectively. There are two peaks in the M phase profile. The more significant maximum is at ∼800 kb, which corresponds to the loop formed by condensin.26 Condensin binding can also lead to enhanced contacts at short ranges (∼300 kb), similar to the range in which cohesin forms loops in the I phase.26,74 (c) Time evolution of for the I → M transition. The dashed lines indicate the sizes of the cohesin (green) and condensin (blue) loops. (d) The change of for the cohesin and condensin loops extracted from (c) for the I → M transition. (e), (f) As (c) and (d) but for the M → I transition.

