
Fig. 6.
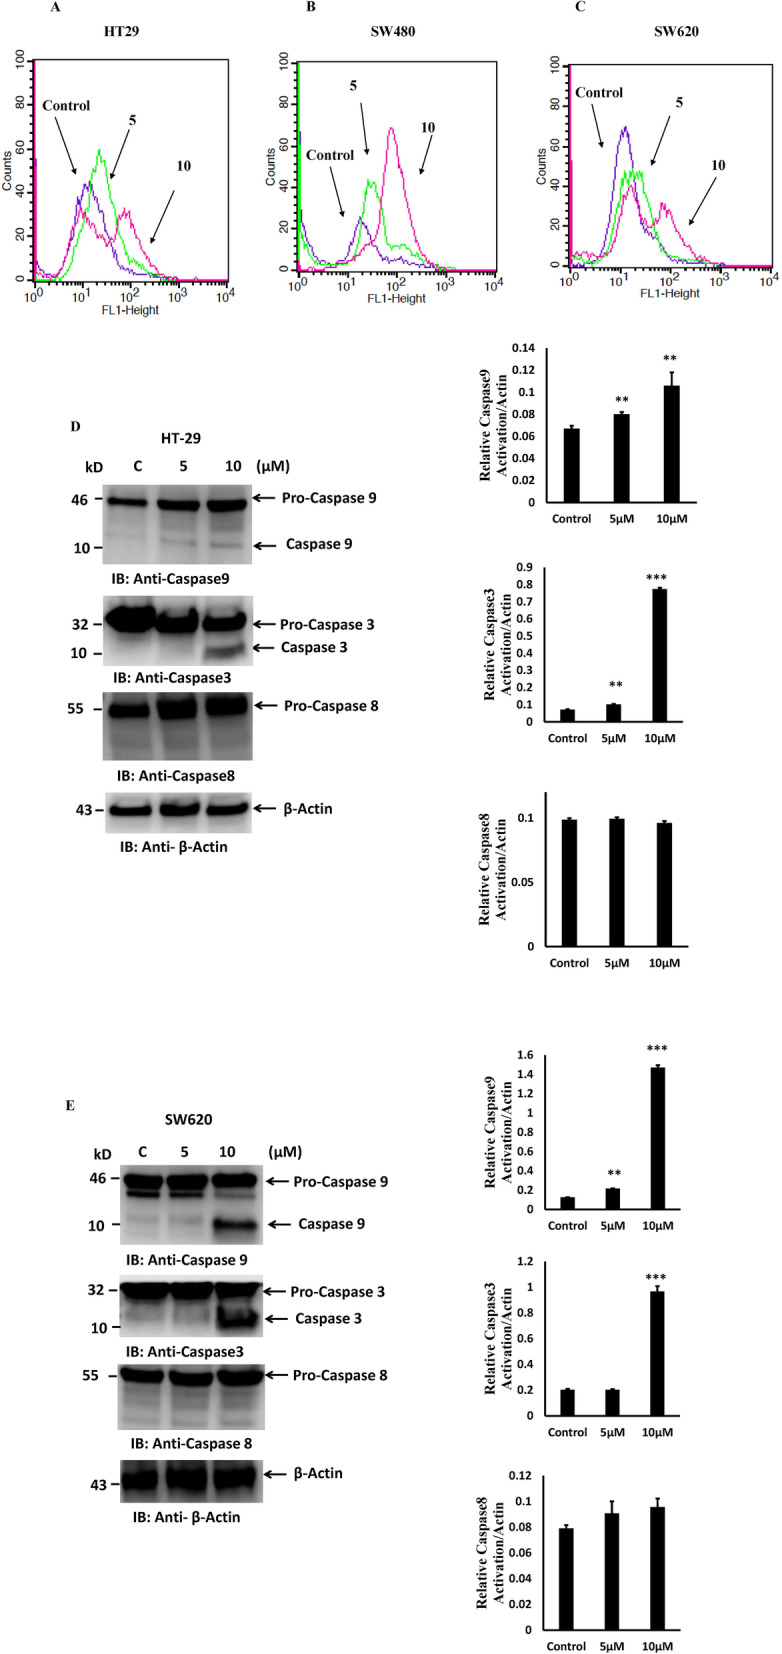
PT activates intrinsic apoptotic pathway. a HT-29 b SW480 c SW620 cells treated with different concentration of PT for 24 h at 37 °C. Activation of caspase-3 and -7 was analyzed by flow cytometry. d HT-29 e SW620 cells were exposed to different concentration of PT for 24 h at 37 °C. Total cell lysates were immunoblotted with the indicated antibodies. Density of the protein bands of three independent experiments were quantified and expressed as relative protein expression to actin. The bar graphs are presented as mean ± SD of three independent experiments. **p < 0.01, ***p < 0.001 vs control. Full Length blots were presented in Supplementary Figure S2