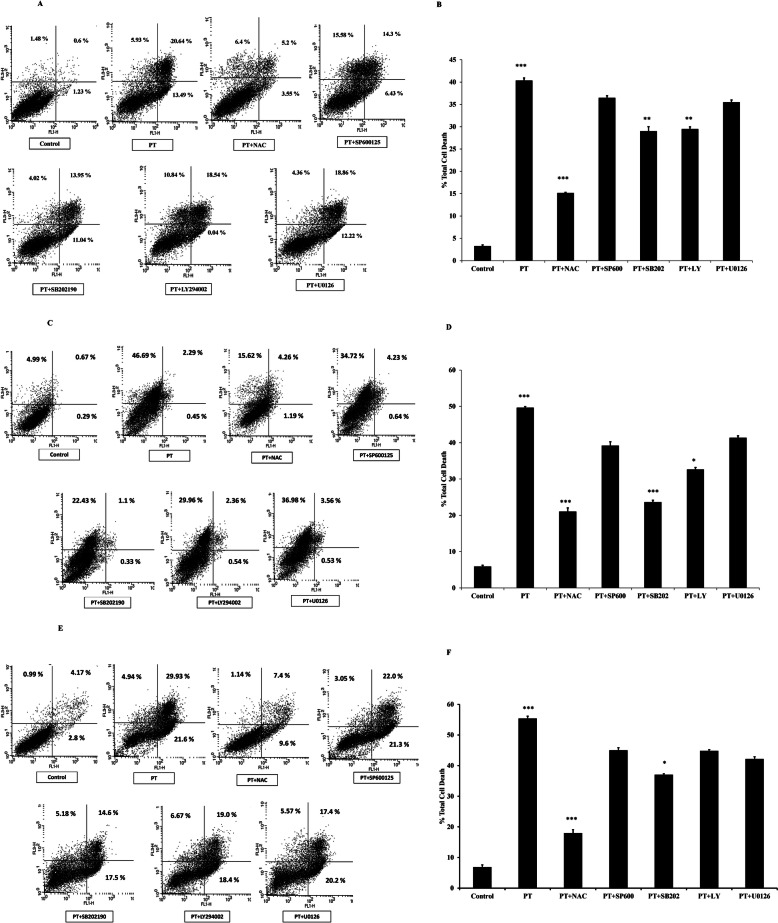
Fig. 7.
PT-induced apoptosis depends on ROS and p38 MAPK. a HT-29 c SW480 e SW620 cells were pre-treated with NAC (5 mM), SP600125 (10 μM), SB202190 (10 μM), LY294002 (10 μM) and U0126 (10 μM) for 1 h and then exposed to PT (10 μM) for 24 h at 37 °C. Total cell death was determined by Annexin V/PI staining using flow cytometry. The bar graph shows the percentage of total cell death and apoptotic/ necrotic cells and the results are presented as mean ± SD of three independent experiments. b %Total cell death ***p < 0.001 PT vs control and ****p < 0.001 PT + NAC vs PT signify a statistically significant difference. **p < 0.01 PT + SB202 vs PT; **p < 0.01 PT + LY vs PT statistically significant. d %Total cell death ***p < 0.001 PT vs control; ***p < 0.001 PT + NAC vs PT; ***p < 0.001 PT + SB202 vs PT; *p < 0.05 PT + LY vs PT. f % Total cell death ***p < 0.001 PT vs control; ***p < 0.001 PT + NAC vs PT; *p < 0.05 PT + SB202 vs PT

