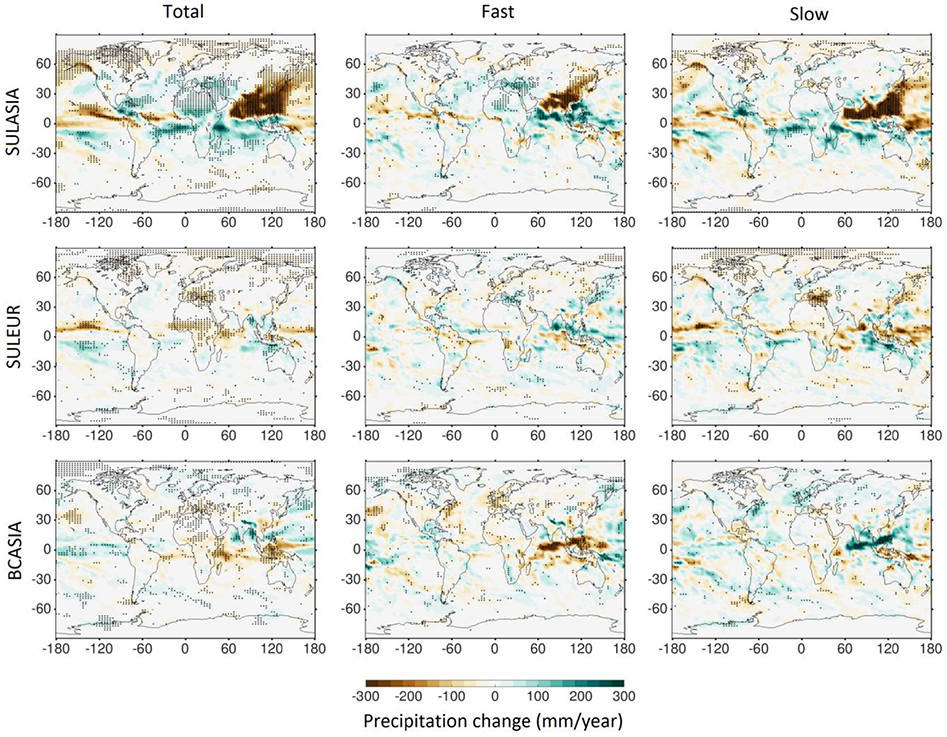
Figure 1:

Annual multi-model mean precipitation response in the regional aerosol perturbation experiments. The columns correspond to total, fast, and slow precipitation response, respectively. Stippled regions indicate where the multi-model mean precipitation change is at least one standard deviation away from zero.
