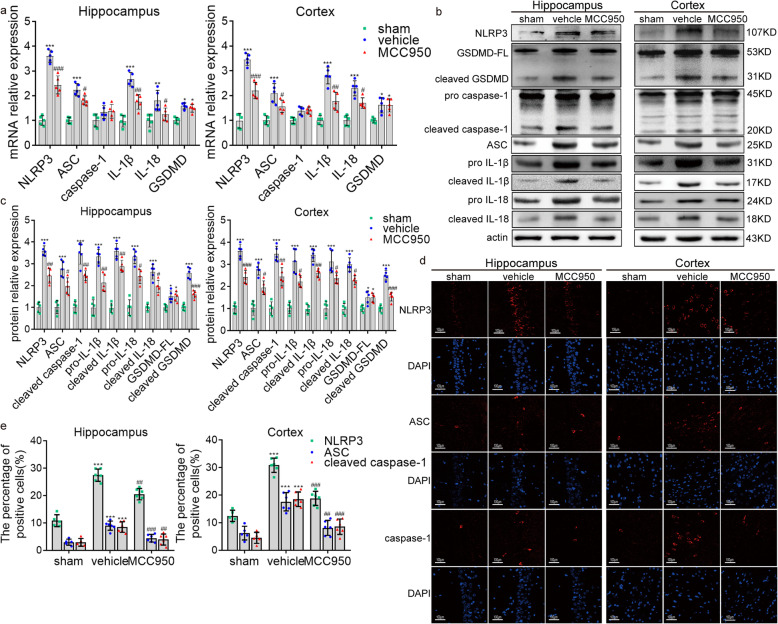
Fig. 5.
The effect of MCC950 on the level of molecules associated with pyroptosis. a–c qRT-PCR and Western blotting results showing the mRNA levels (a) and protein levels (b, c) of NLRP3, ASC, caspase-1, GSDMD, IL-1β, and IL-18 among the sham, vehicle, and MCC950 groups. GSDMD-FL, full-length GSDMD. d, e Immunofluorescence staining results showing the protein expression of NLRP3, ASC, and cleaved caspase-1 among the sham, vehicle, and MCC950 groups. All data in this figure are analyzed using parametric test. Data are presented as mean ± SD. Statistical significances are determined with one-way ANOVA followed by Tukey’s post hoc test. *P < 0.05, **P < 0.01, ***P < 0.001 versus sham; #P < 0.05, ##P < 0.01, ###P < 0.001 versus vehicle. n = 5–6 per group

