
Fig. 4.
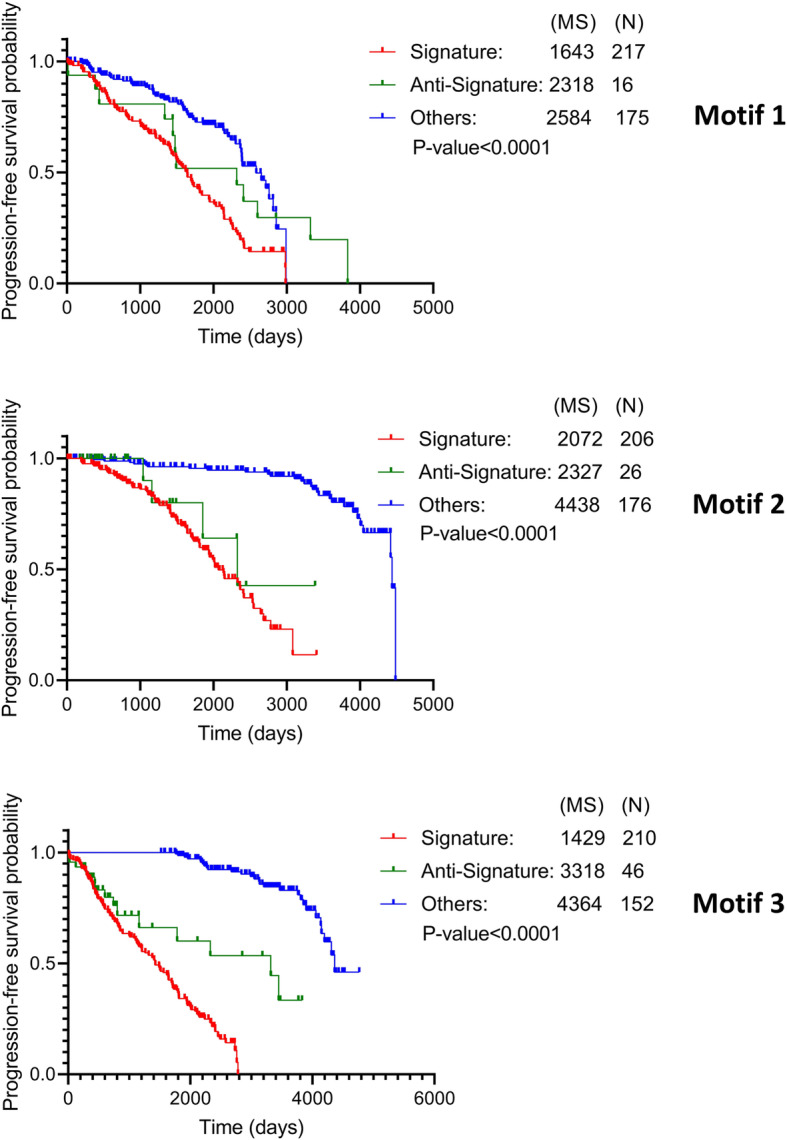
Kaplan–Meier plots for progression-free survival probability of patient subgroups (Signature, Anti-Signature, and Others). This is based on the expression pattern of motif-constituting nodes as defined in Table 2. Patients that do not follow either Signature or Anti-Signature expression patterns are added in Others group. For each group, the number of patients (N) and mean progression-free survival time (MS) in days is provided. The log-rank test was used to assess differences in survival time between all three patient subgroups